Design Case study
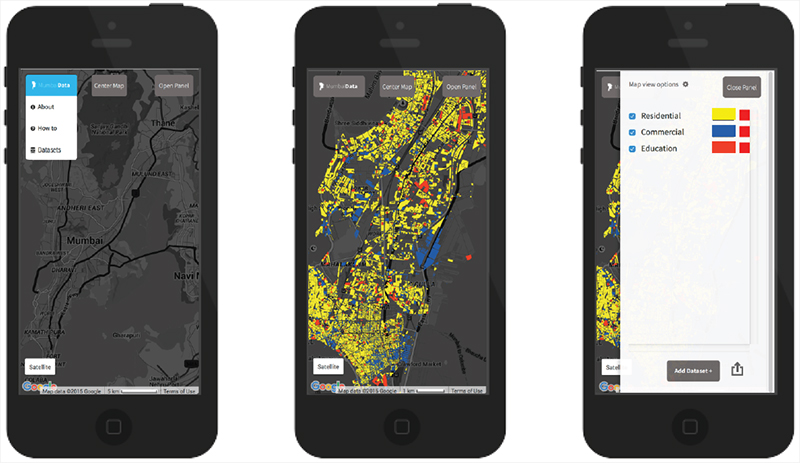
Data Visualization for Mumbai
An easy way to visualize the city’s spatial data
by
Links
Bibliography:
- Censusindia.gov.in. (2015). Census of India
Website : Office of the Registrar General and Census Commissioner, India. [online]
Available at: http://www.censusindia.gov.in/
- Opendatahandbook.org. (2015). The Open Data Handbook. [online]
Available at: http://opendatahandbook.org/
- Wikipedia. (2015). Open data. [online]
Available at: https://en.wikipedia.org/wiki/Open_data
- Mcgm.gov.in. (2015). Welcome to The Municipal Corporation of Greater Mumbai. [online] Available at:
http://www.mcgm.gov.in/irj/servlet/prt/portal/prteventname/HtmlbEvent/prtroot/pcd!3aportal_content!2fcom.mcgm.fcontent_MCGM!2fcom.mcgm.faboutus!2fcom.mcgm.rHome!2fcom.mcgm.pAboutUsHome!2fdev_plan/documents/Draft%20Development%20Plan/?QuickLink=qlddevplan
- Scientificamerican.Com. (2015). Why Are More People Right-Handed?. [Online]
Available At: http://www.scientificamerican.com/article/whyare-more-people-right/
- Boy, Jeremy; Detienne, Francoise; Fekete, Jean-Daniel. (2015). Storytelling in Information
Visualizations: Does it Engage Users to Explore Data?. CHI '15: Proceedings of the 33rd Annual ACM Conference on Human Factors in Computing Systems
- Chandola, Varun; Vatsavai, Ranga Raju; Bhaduri, Budhendra. (2011). iGlobe: an interactive visualization and analysis framework for geospatial data. COM.Geo '11: Proceedings of the 2nd International Conference on Computing for Geospatial Research and Applications
- Dubner, Stephen; Levitt, Steven. (2005). Freakonomics
- Gao, Tong; Hullman, Jessica; Adar, Eytan; Hecht, Brent; Diakopoulos, Nicholas. (2014). NewsViews: An Automated Pipeline for Creating Custom Geovisualizations for News. CHI '14: Proceedings of the SIGCHI Conference on Human Factors in Computing Systems
- Graves, Alvaro; Handler, James. (2013). Visualization tools for open government data. dg.o '13: Proceedings of the 14th Annual International Conference on Digital Government Research
- Lu, Yun; Zhang, Mingjin; Li, Tao; Guang, Pudong; Rishe, Naphtali. (2013). Online spatial data analysis and visualization system. IDEA '13: Proceedings of the ACM SIGKDD Workshop on Interactive Data Exploration and Analytics
- Maeda, John, (2006). Laws of Simplicity
- Mayer-Schonberger, Victor; Cukier, Kenneth. (2013). Big Data
- MCGM. (2010). Mumbai Human Development Report 2009
- MCGM. (2015). Preparatory Studies DP 2014-34
- Meirelles, Isabel. (2013). Design of Information
- Ministry of Urban Development India. (2014). Urban and Regional Development Plans Formulation & Implementation Guidelines
- Myers, Risa B.; Lomax, James W.III; Manion, Frank J.; Wood, Nancy M.; Johnson, Todd R. (2010). Data visualization of teen birth rate data using freely available rapid prototyping tools. IHI '10: Proceedings of the 1st ACM International Health Informatics Symposium
- Perer, Adam; Shneiderman, Ben. (2008). Systematic yet flexible discovery: guiding domain experts through exploratory data analysis. IUI '08: Proceedings of the 13th international conference on Intelligent user interfaces
- PRAJA; UDRI. (2014). Planning For Mumbai : The Development Plan For Greater Mumbai 2014-2034
- Shen-Hsieh, Angela; Schindl, Mark. (2002). Data Visualization For Strategic Decision Making. Chi '02: Case Studies Of The Chi2002|Aiga Experience Design Forum
- Tufte, Edward. (1983). Visual Display Of Quantitative Information Tufte, Edward. (1990). Envisioning Information
- Tufte, Edward (1997). Visual Explanations
Other Links:
• Useful resource e-links related to 'Interaction Design'
• Interaction Design at IDC IIT Bombay
Case Study Download:
• Data Visualization for Mumbai......
• Data Visualization for Mumbai_Report......