Design Case study
Visualizing Ecological Change in the Indian Sundarbans
Raising awareness of the Sundarbans' ecology and climate change impacts
by
Case Study - Slide Show
Design process that was followed in this project:
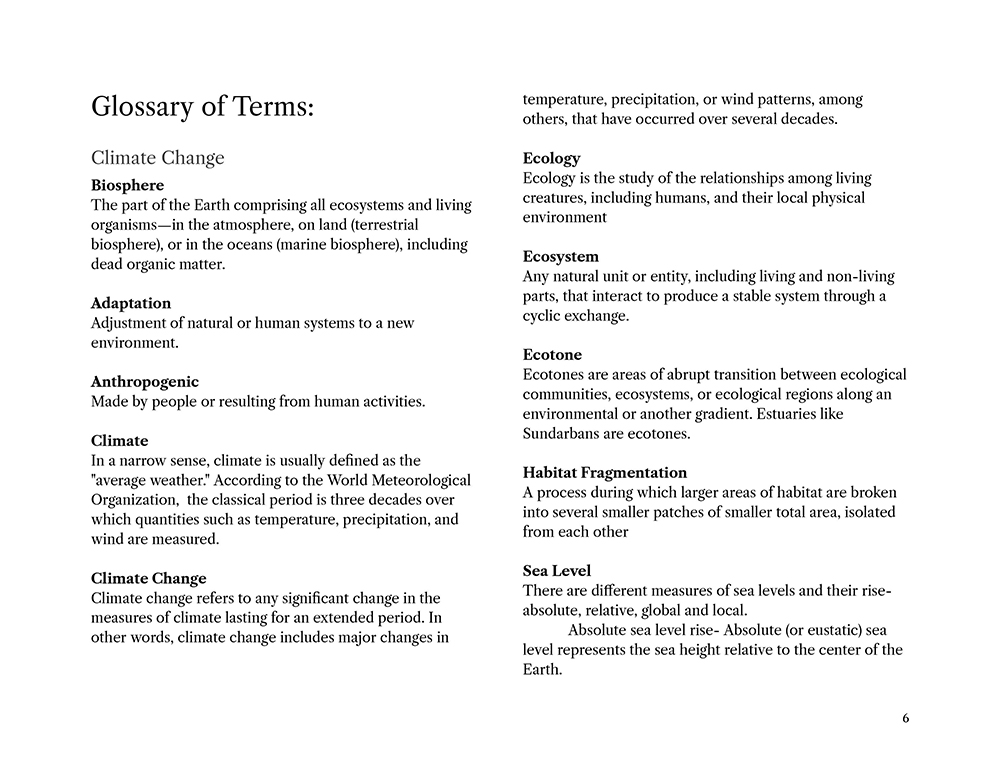
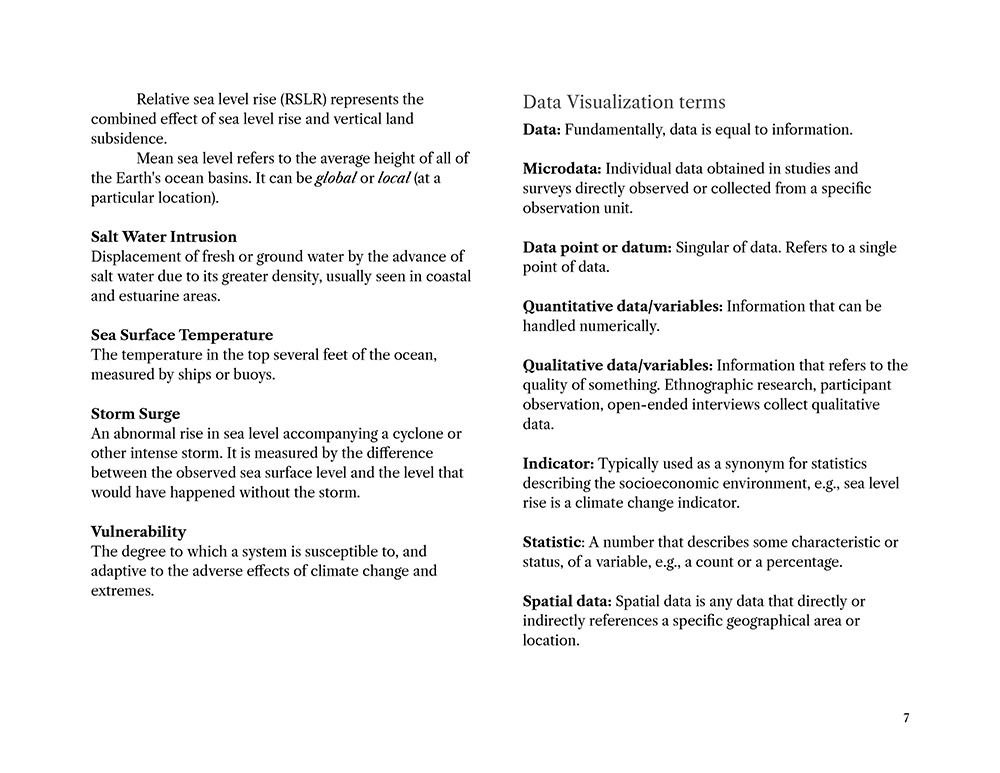
• Glossary of Terms
- Climate Change
- Data Visualization terms
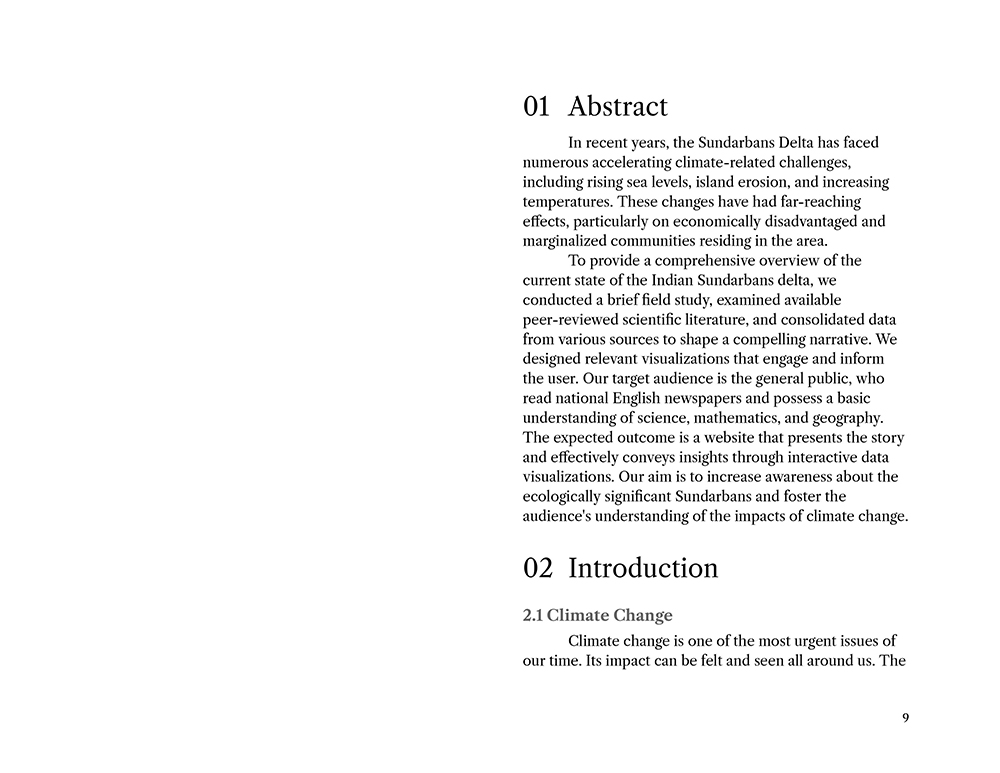
• Introduction
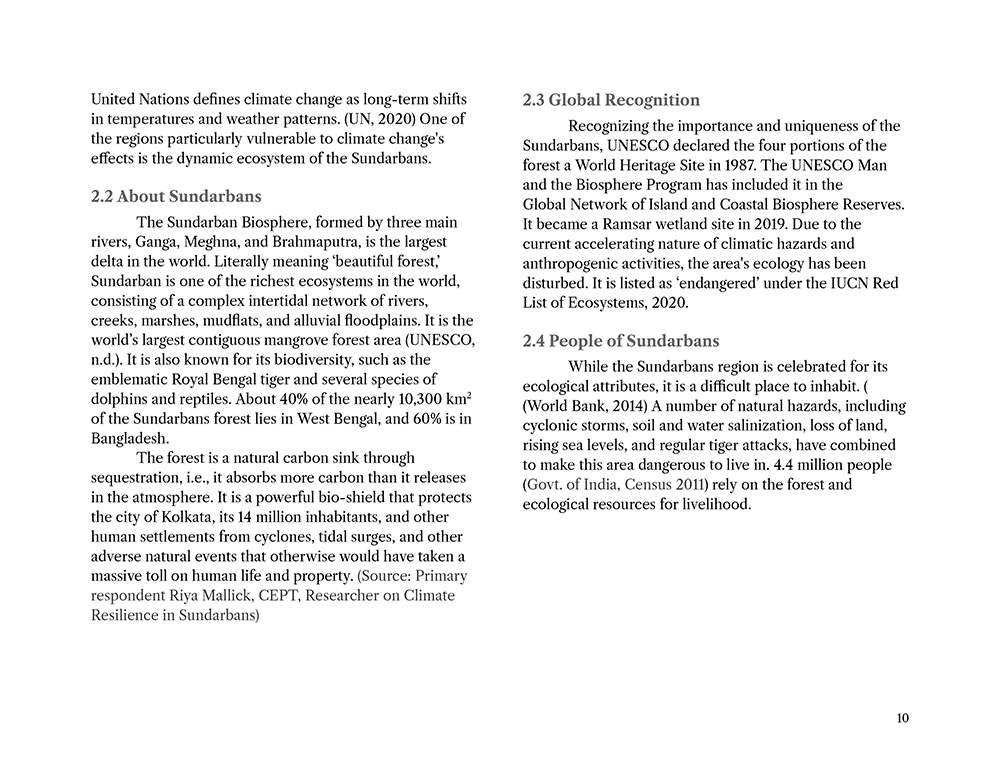
- Climate Change
- About Sundarbans
- Global Recognition
- People of Sundarbans
• Objective
• Motivation
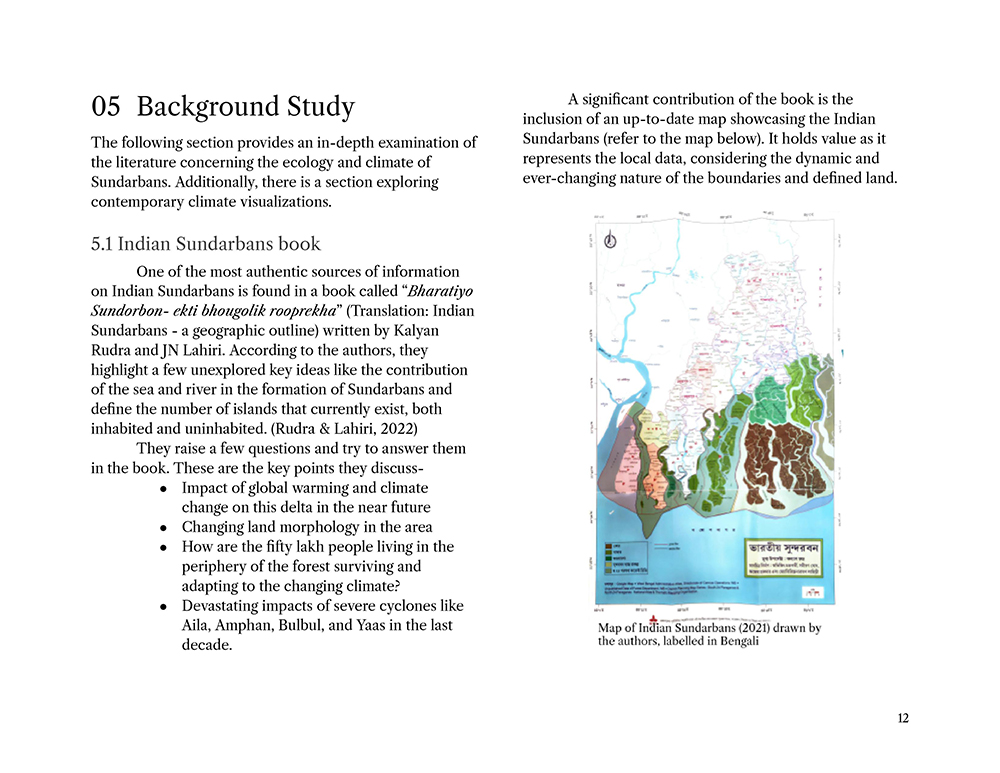
• Background Study
- Indian Sundarbans book
- Published research on Climate
- Summary of the papers read
- Changes in shoreline pattern
- Estuarine dynamics
- Climate change indicators
- Sea surface temperature
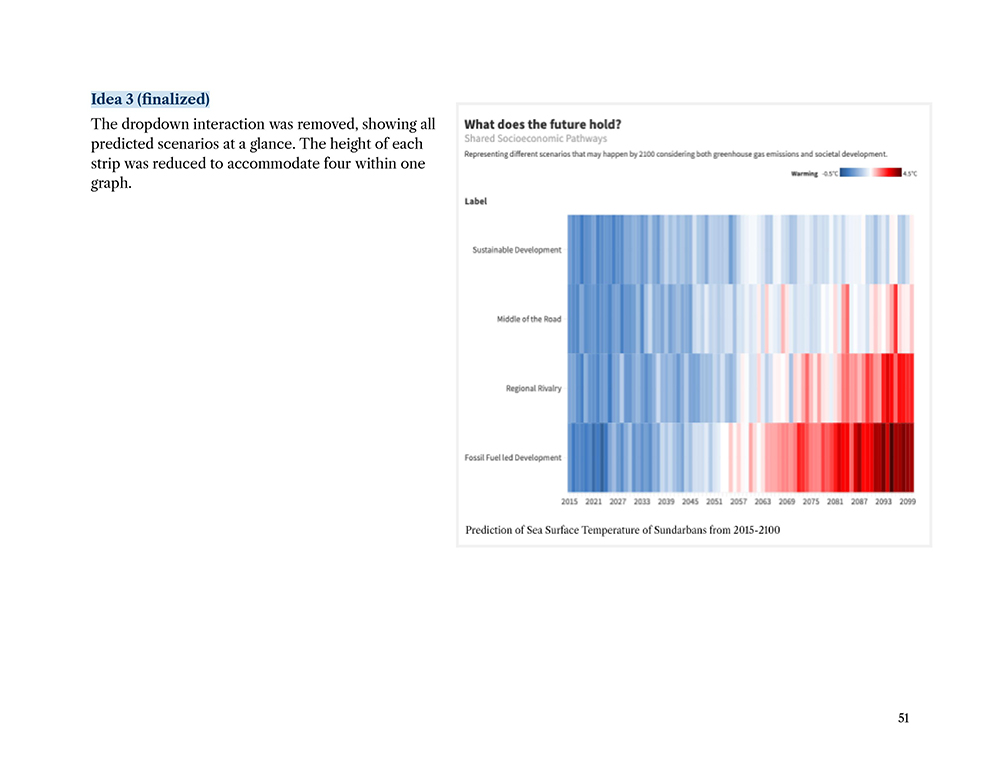
- How are climate futures predicted?
- Sea level rise
- Cyclones
- Salinity
- Biodiversity
- Man and forest
- Socio-economic conditions
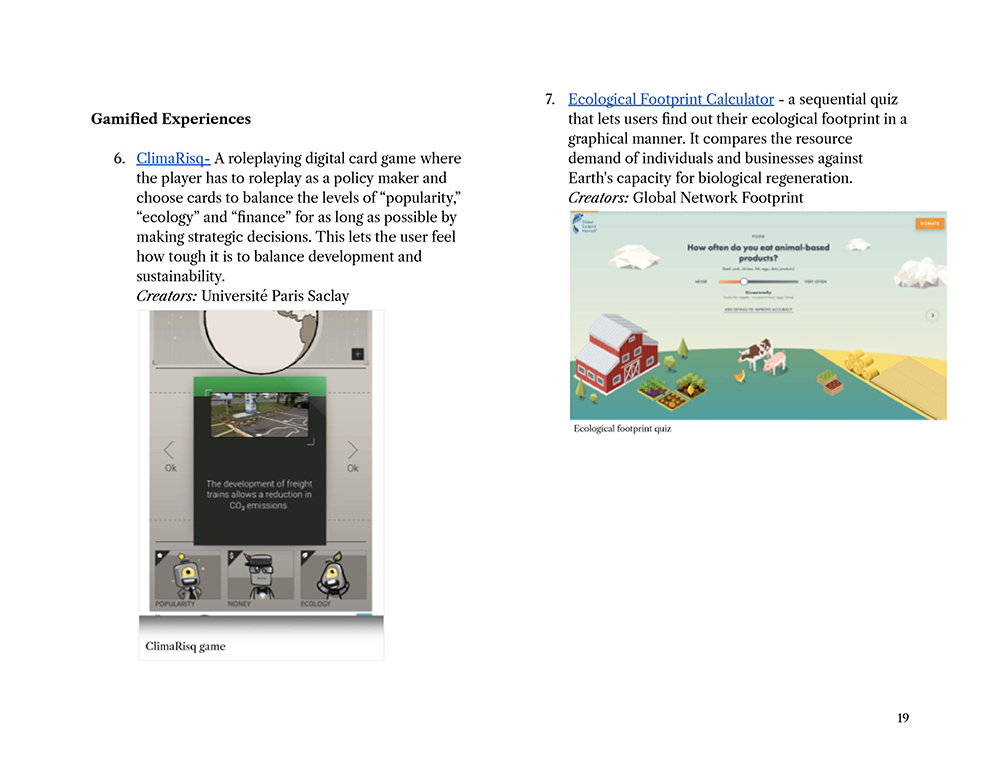
- Existing Visualizations on Climate and Ecology
- Climate Simulators
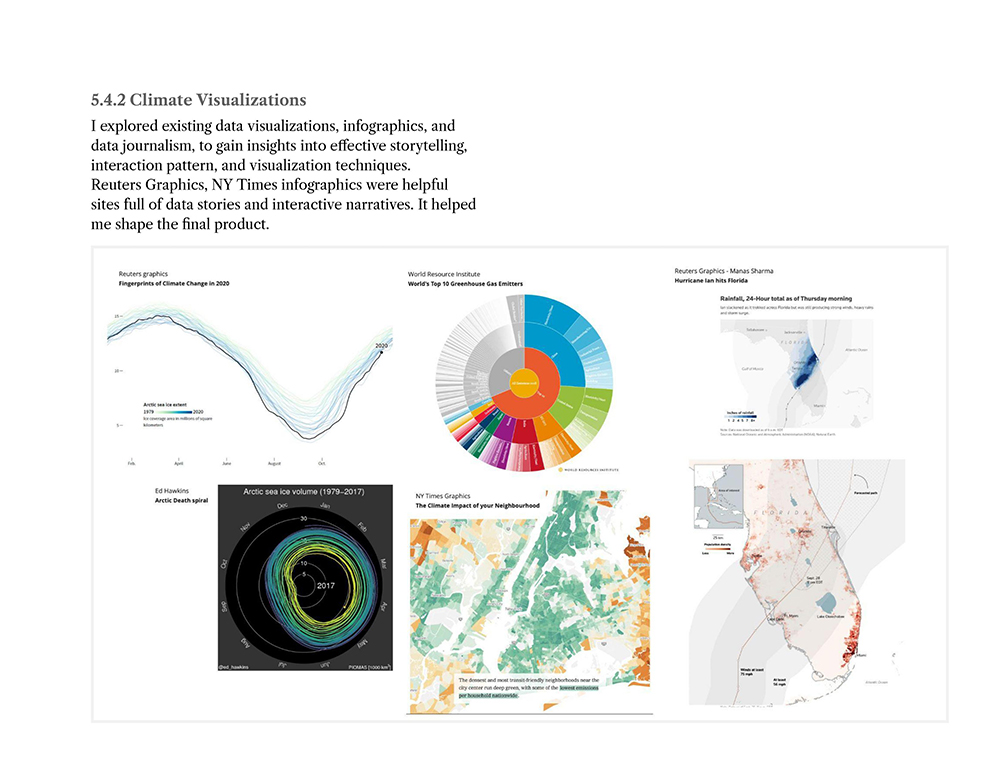
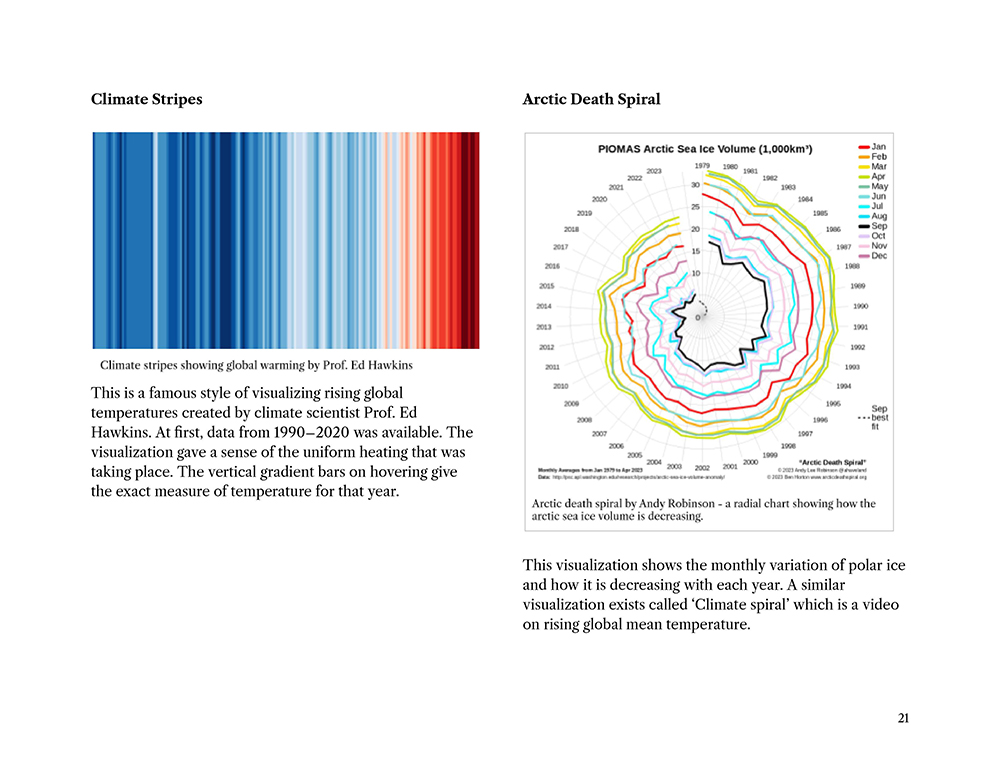
- Climate Visualizations
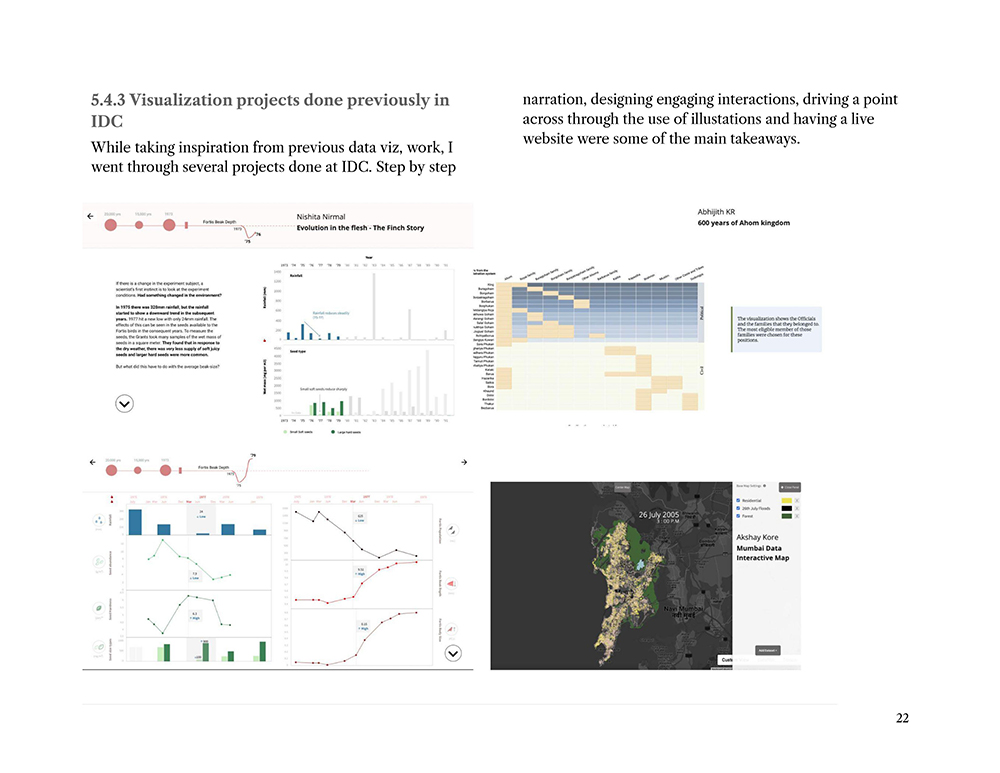
- Visualization projects done previously in IDC
• Primary Research
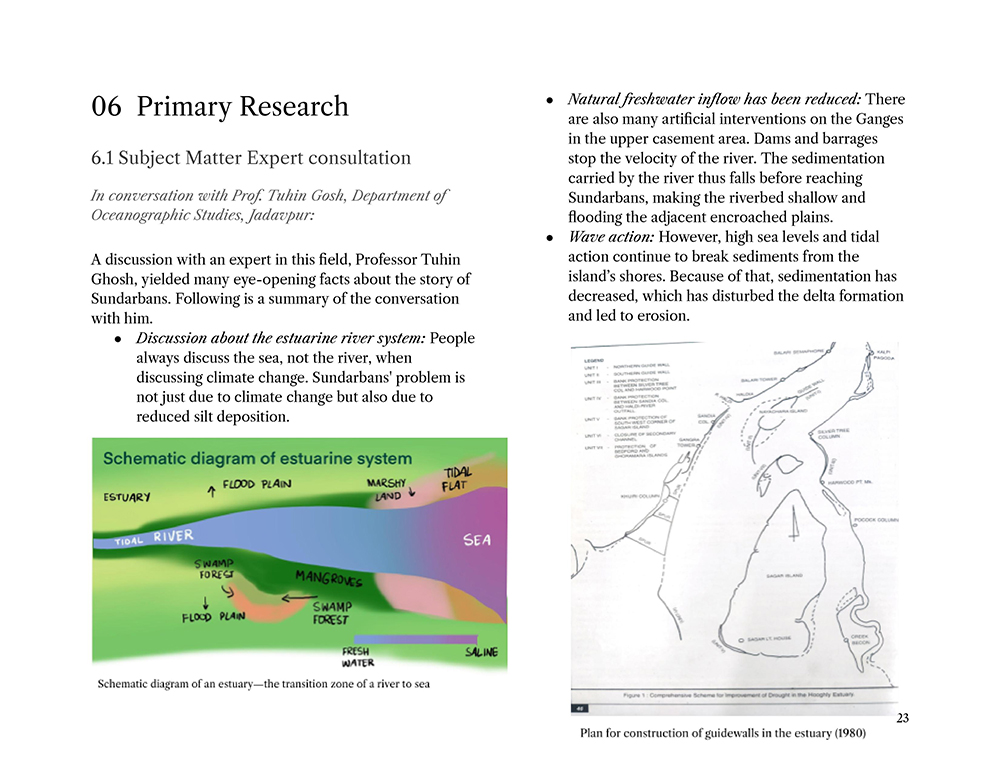
- Subject Matter Expert consultation
- In conversation with Prof. Tuhin Gosh, Department of Oceanographic Studies, Jadavpur:
- In conversation with Jyotinindranarayan Lahiri, founder and editor of Sudhu Sundarban
Charcha
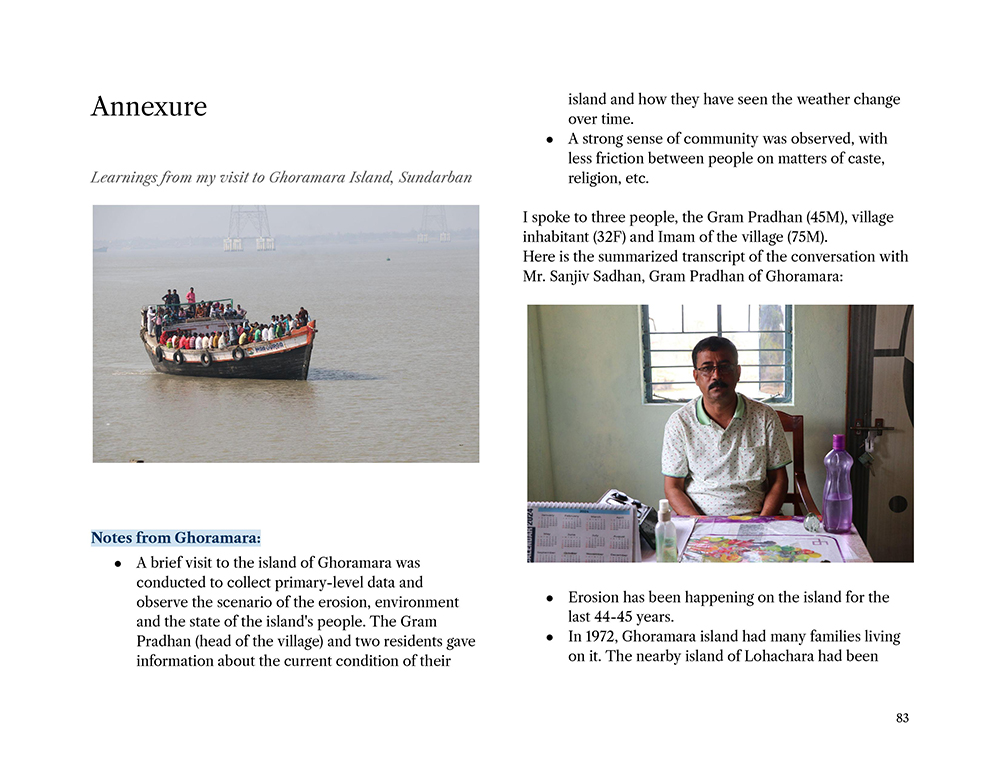
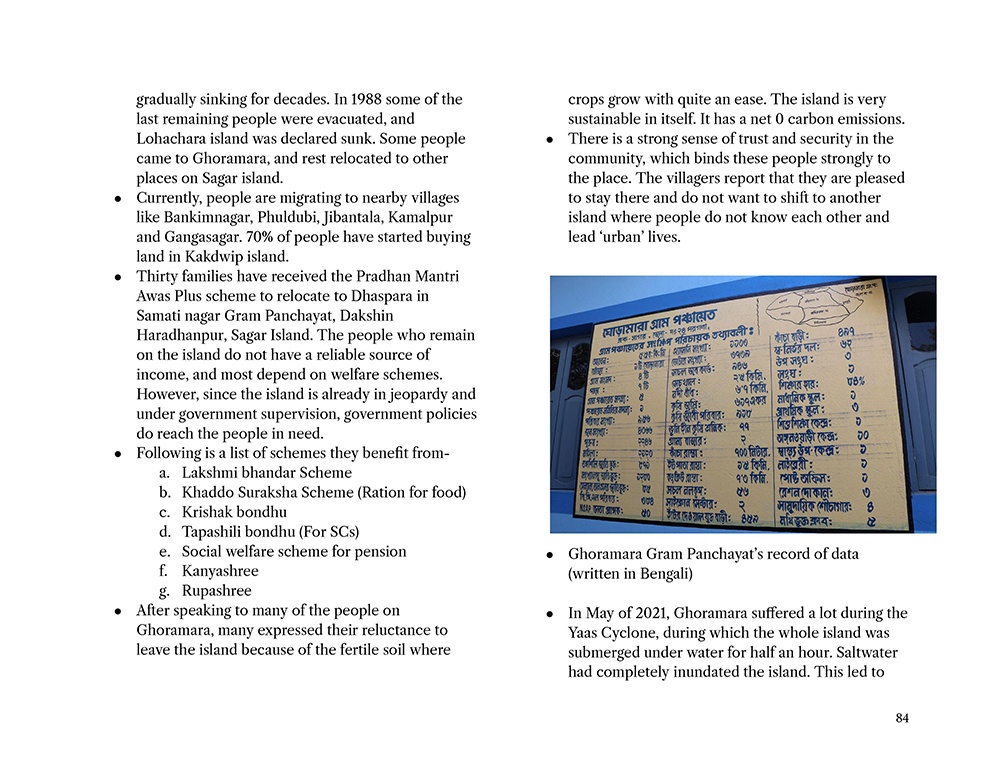
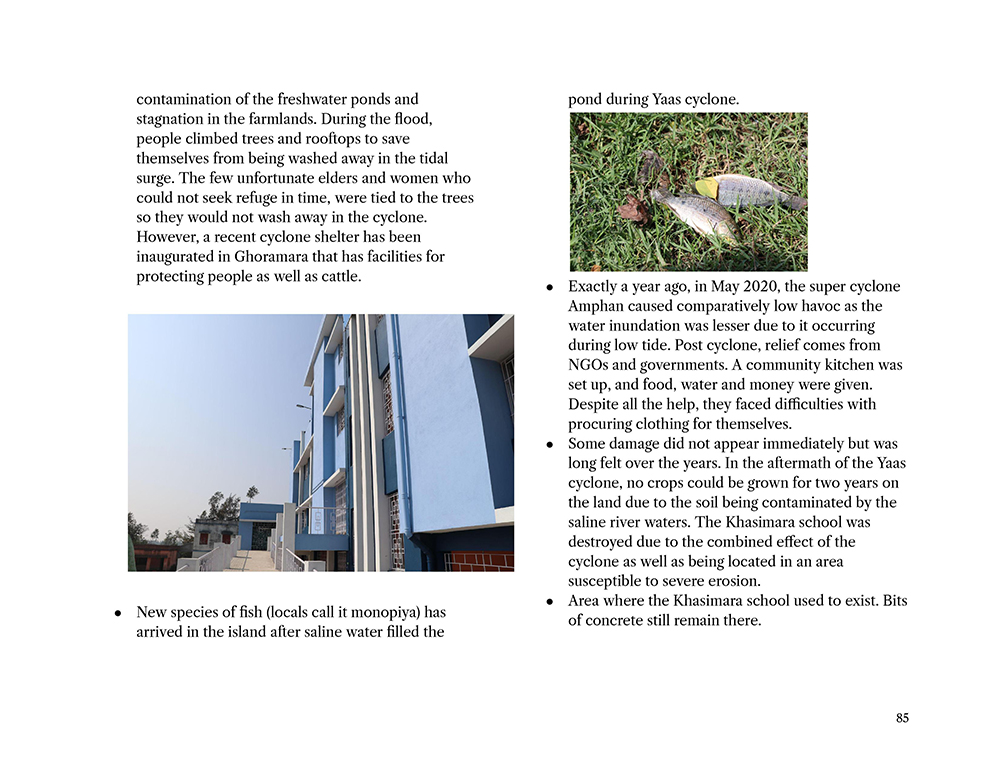
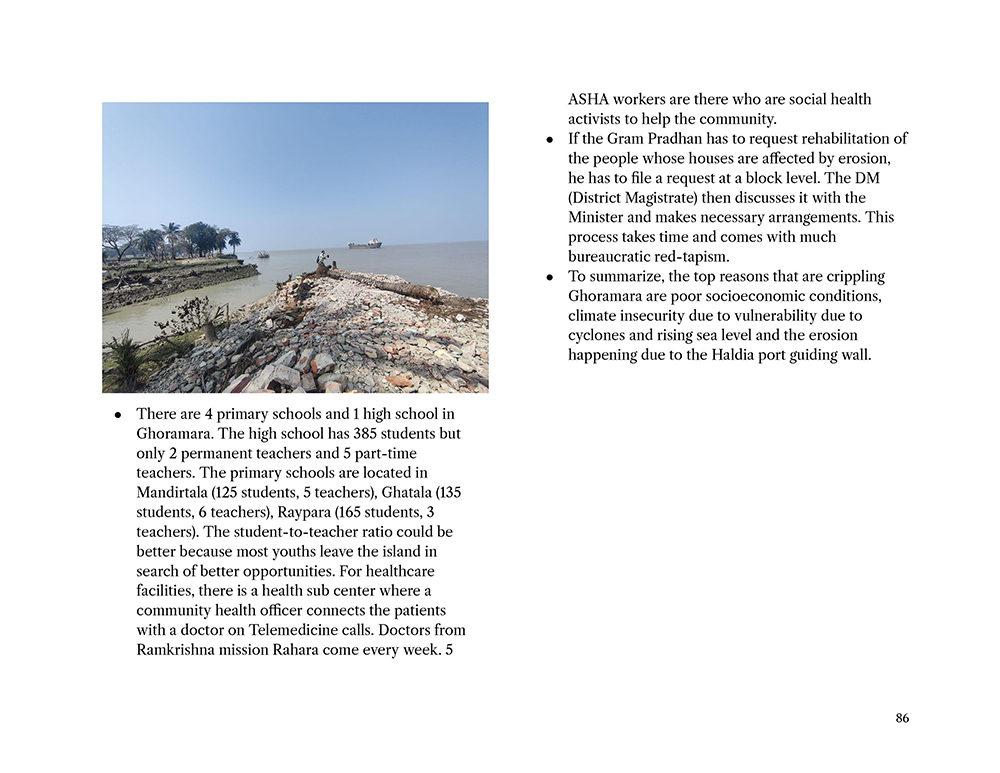
- Findings from Ghoramara
• Scope
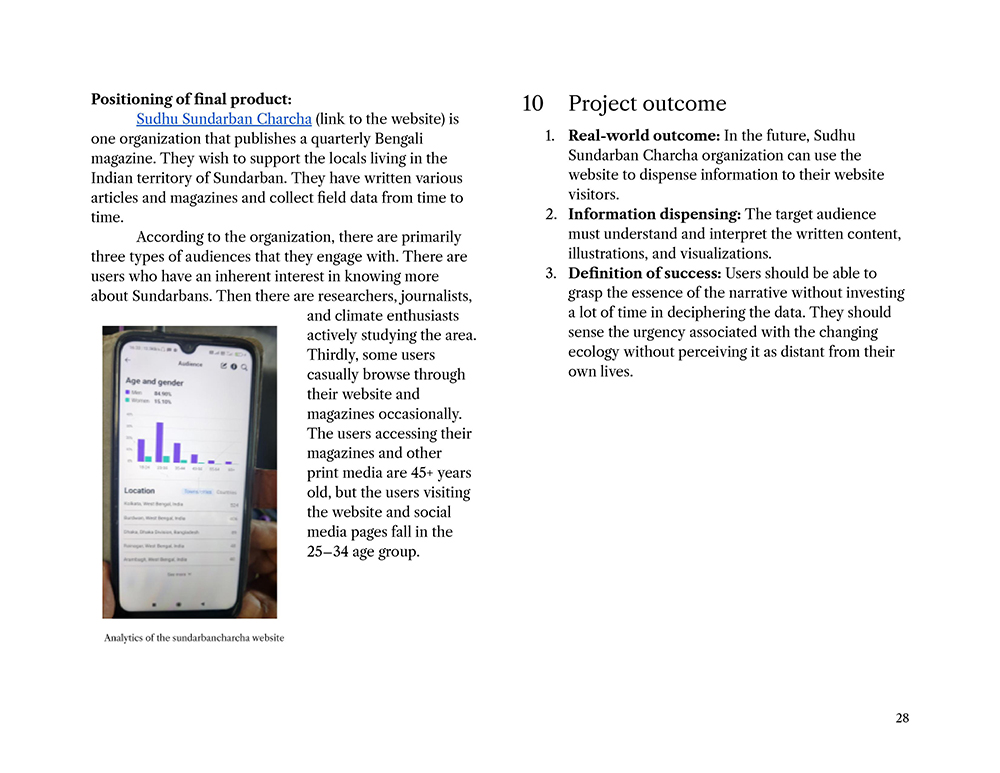
• Target Audience
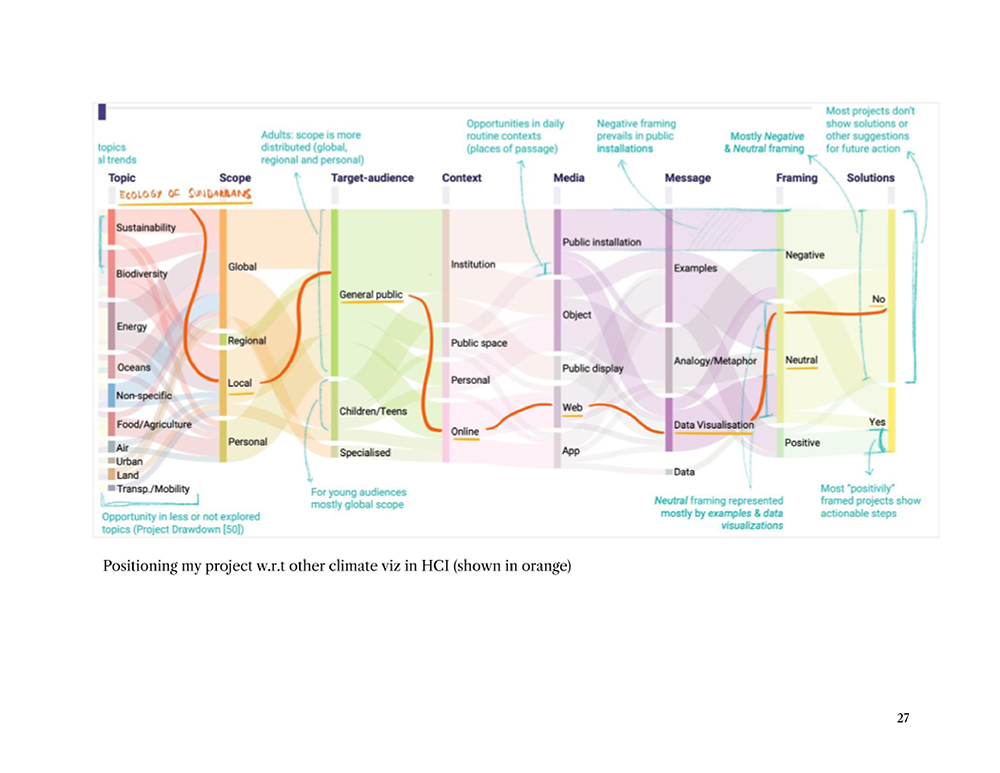
• Positioning
• Project outcome
• Data
- Data Collection
- Types of Data
- Dataset types
- Semantics of Data
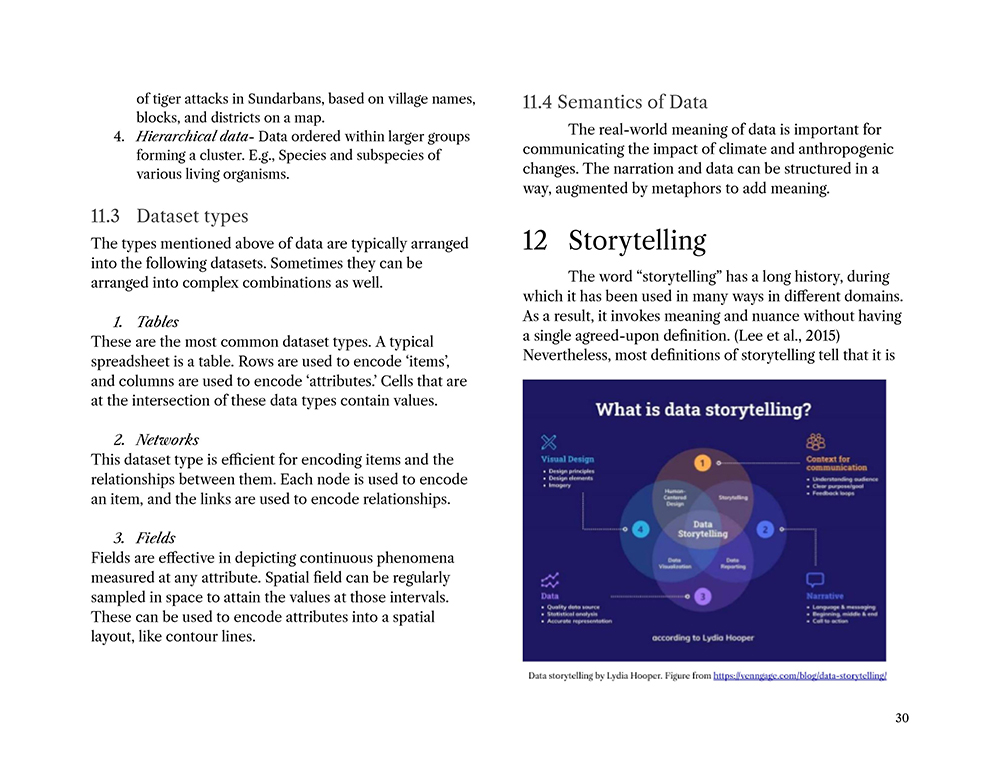
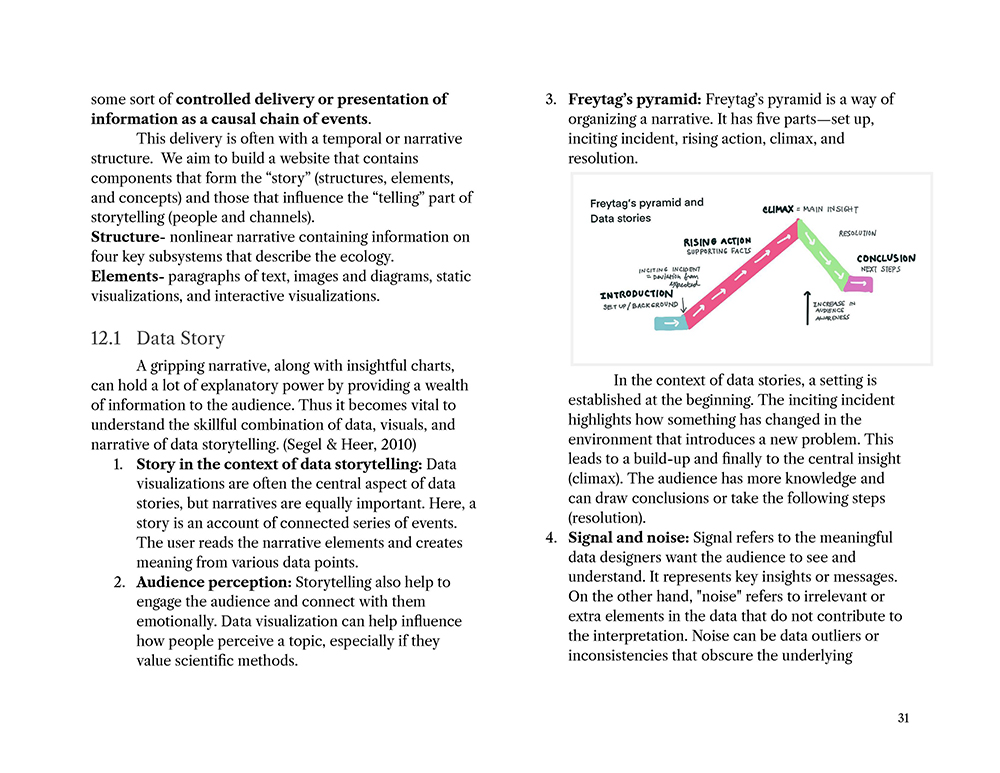
• Storytelling
- Data Story
- Types of Narratives
• Factors to consider when designing:
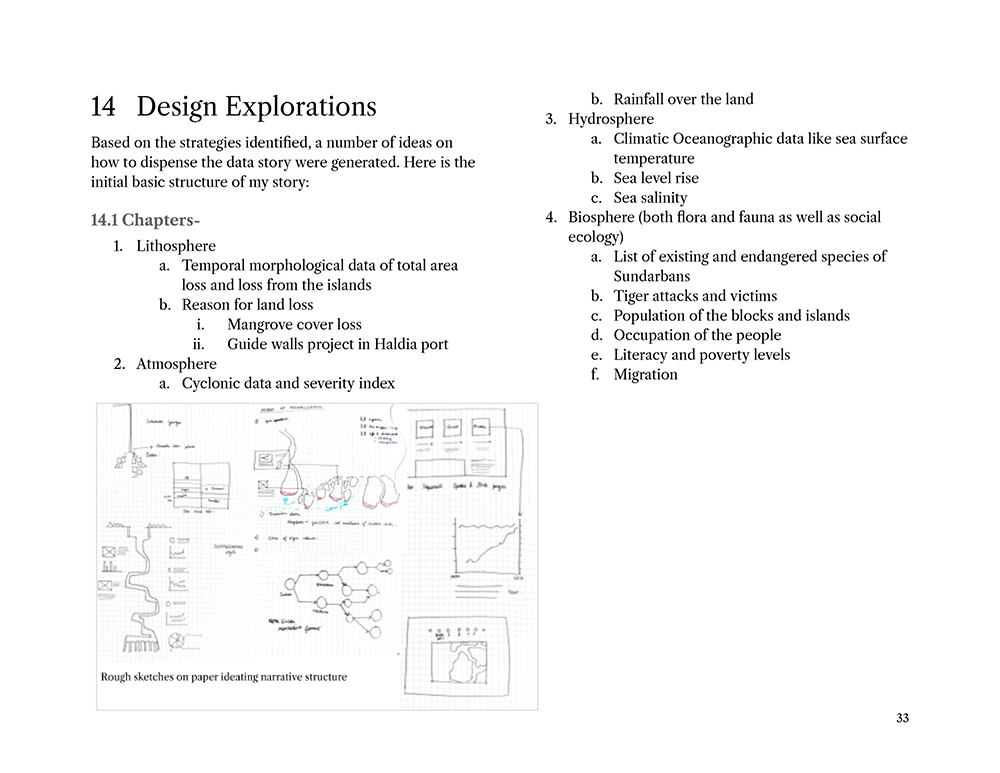
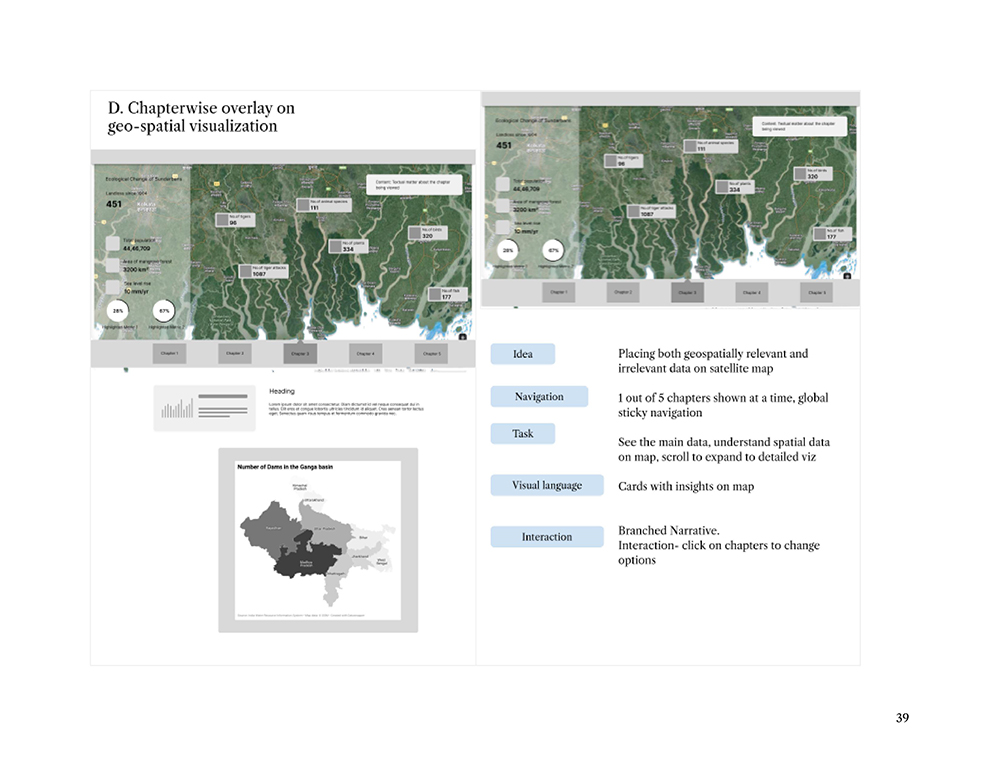
• Design Explorations
- Chapters- 34
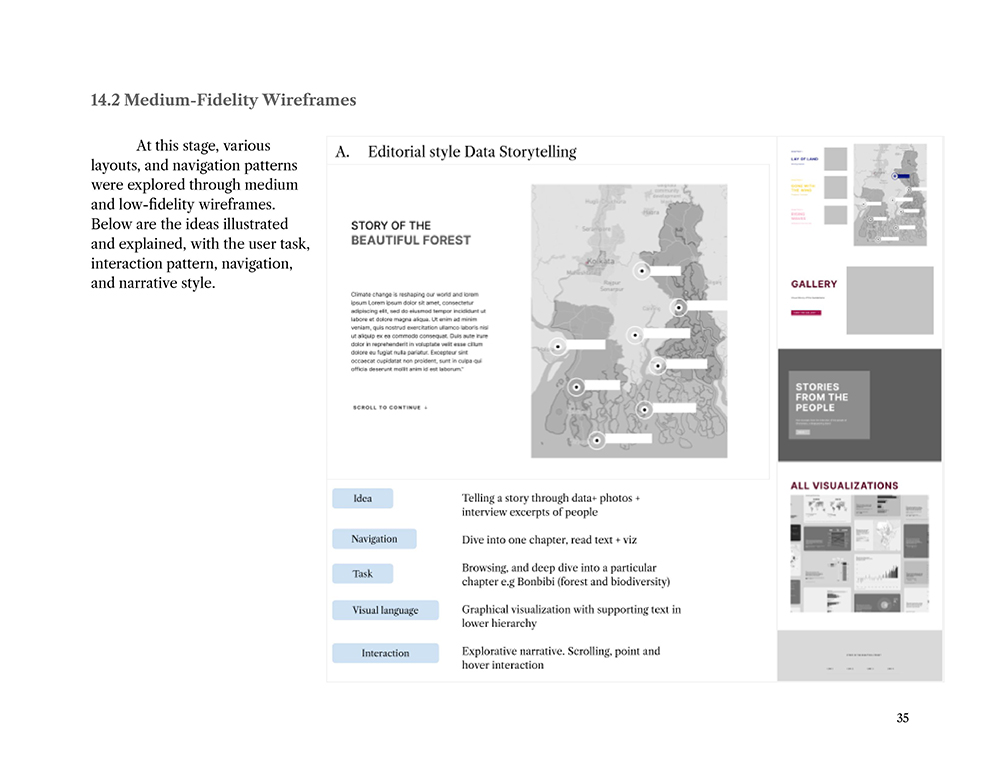
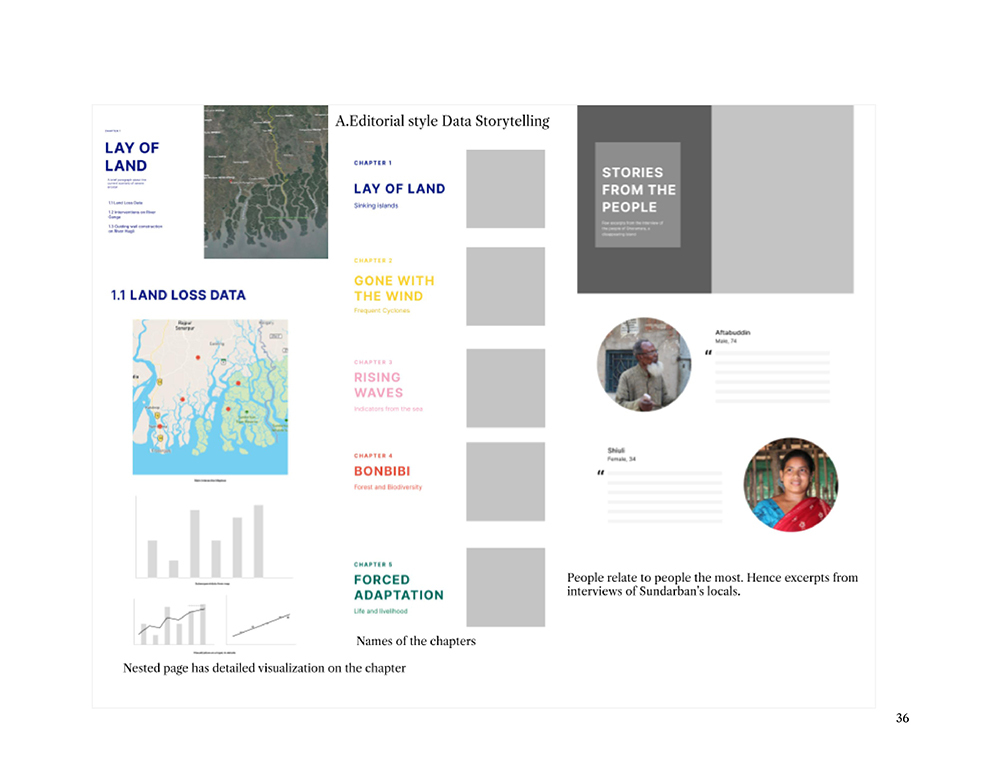
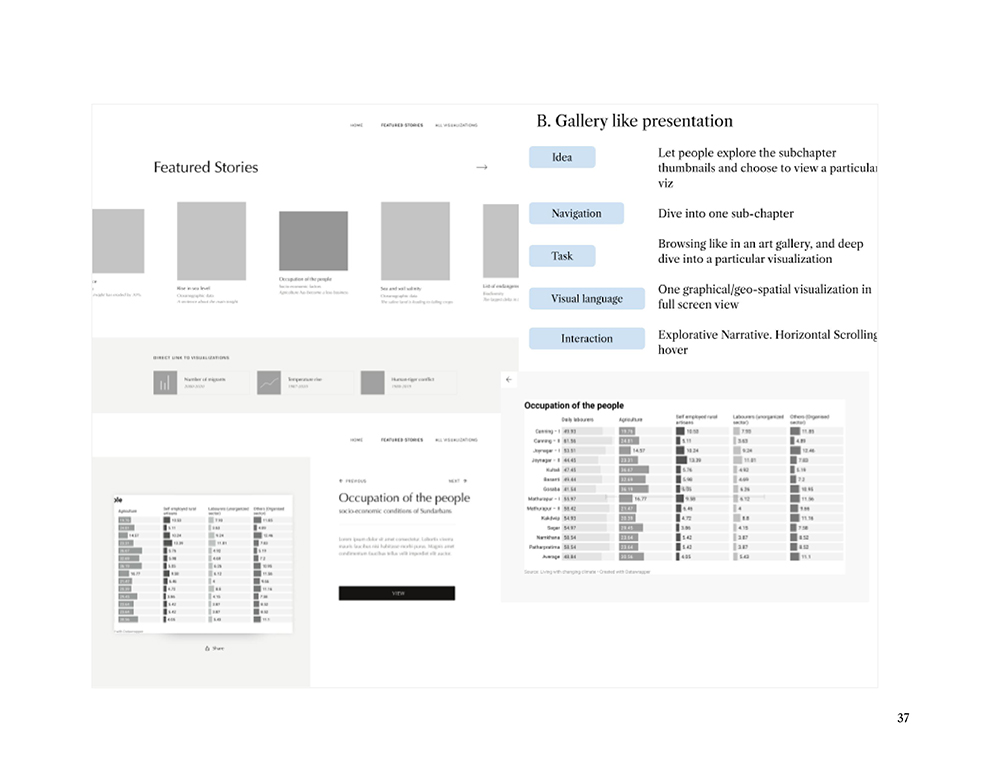
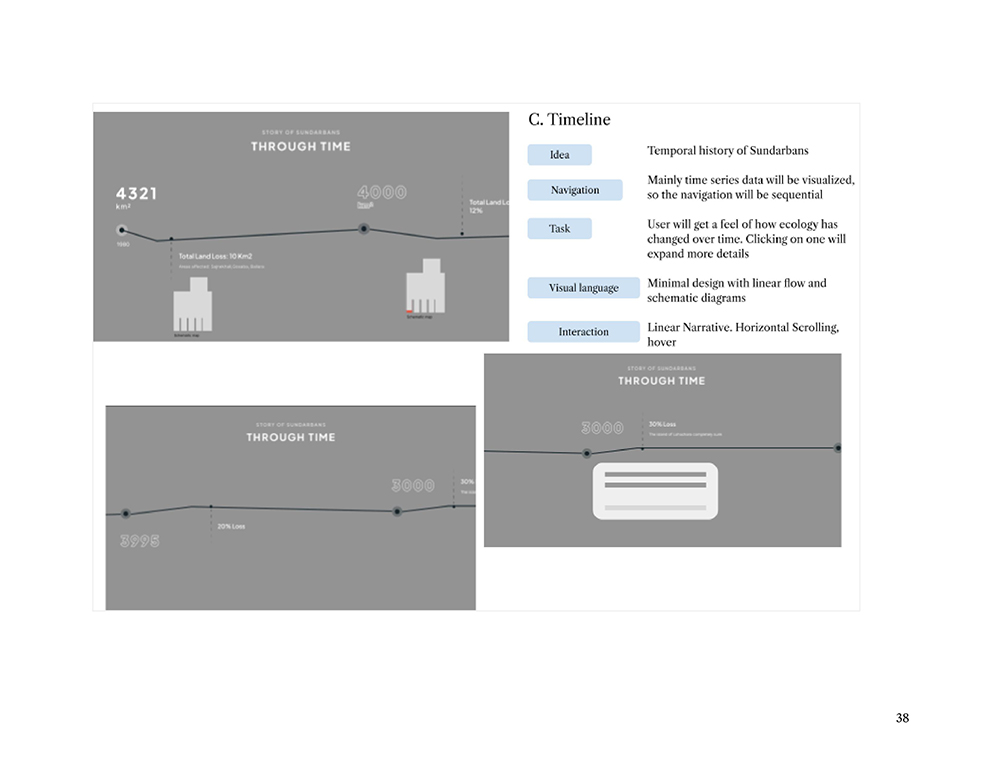
- Medium-Fidelity Wireframes
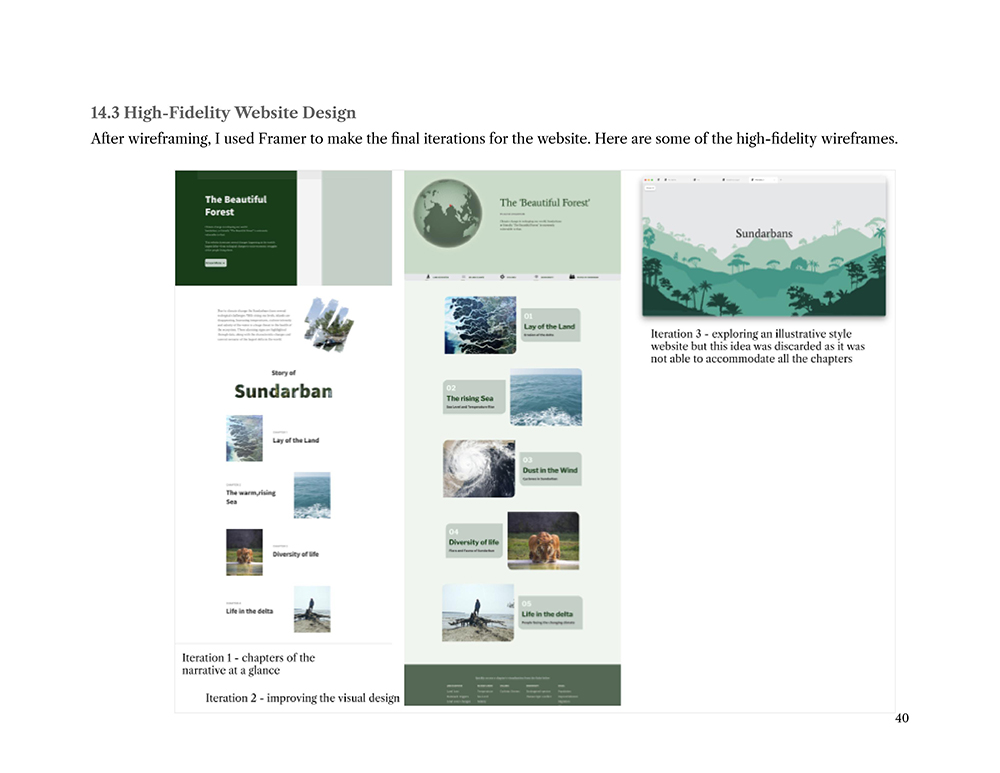
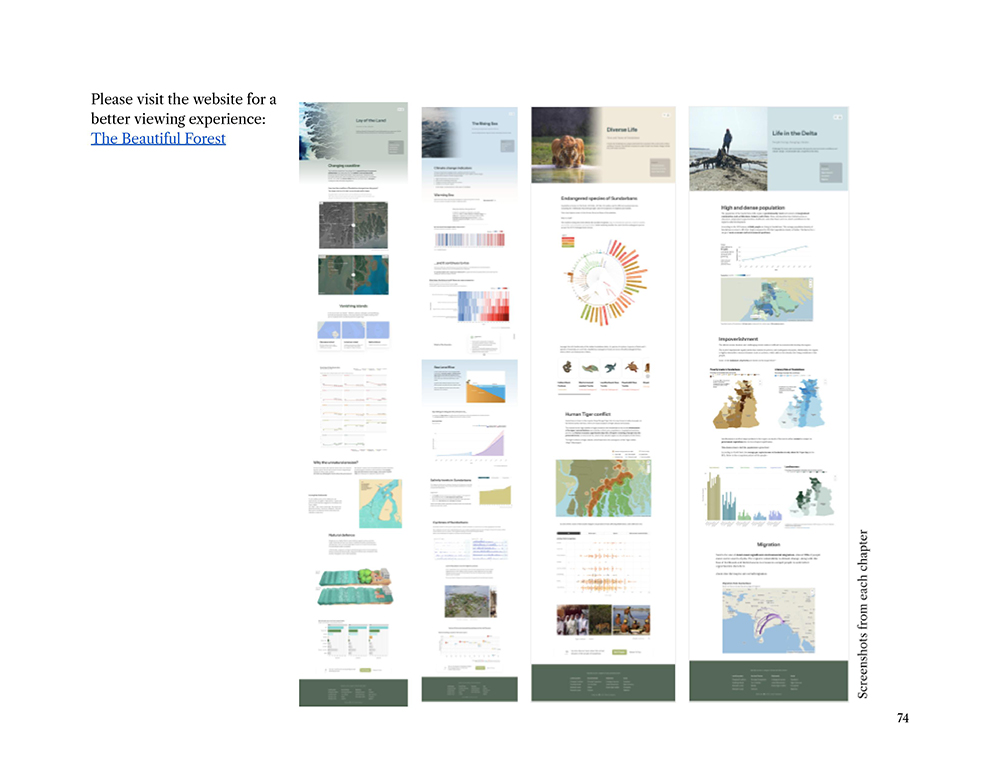
- High-Fidelity Website Design
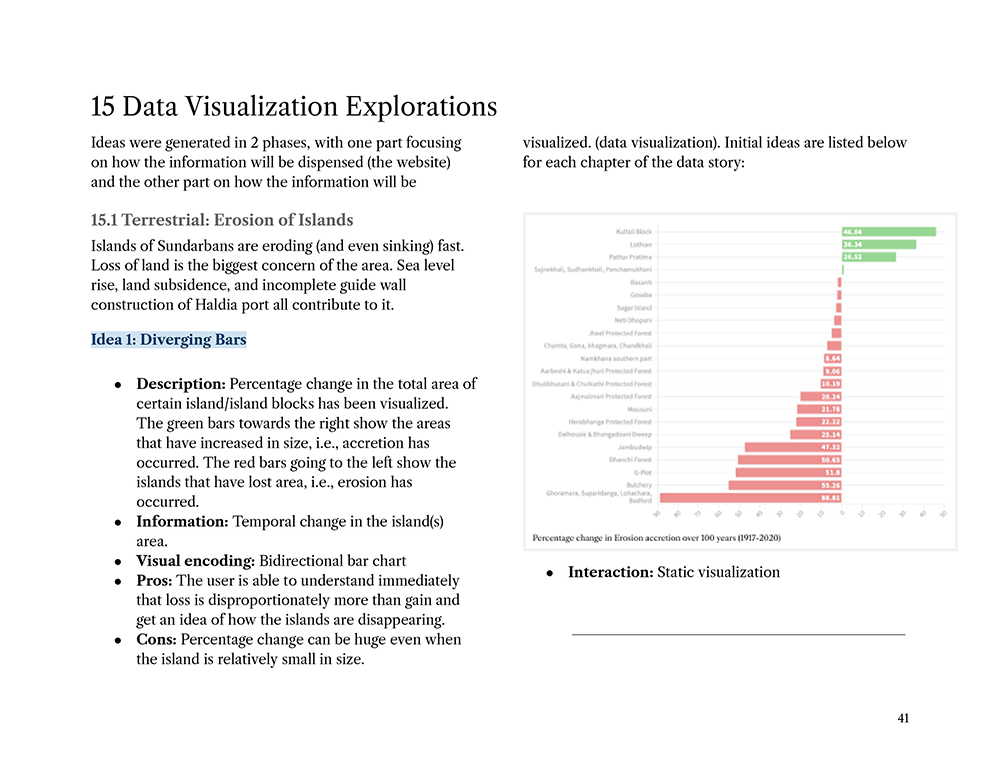
• Data Visualization Explorations
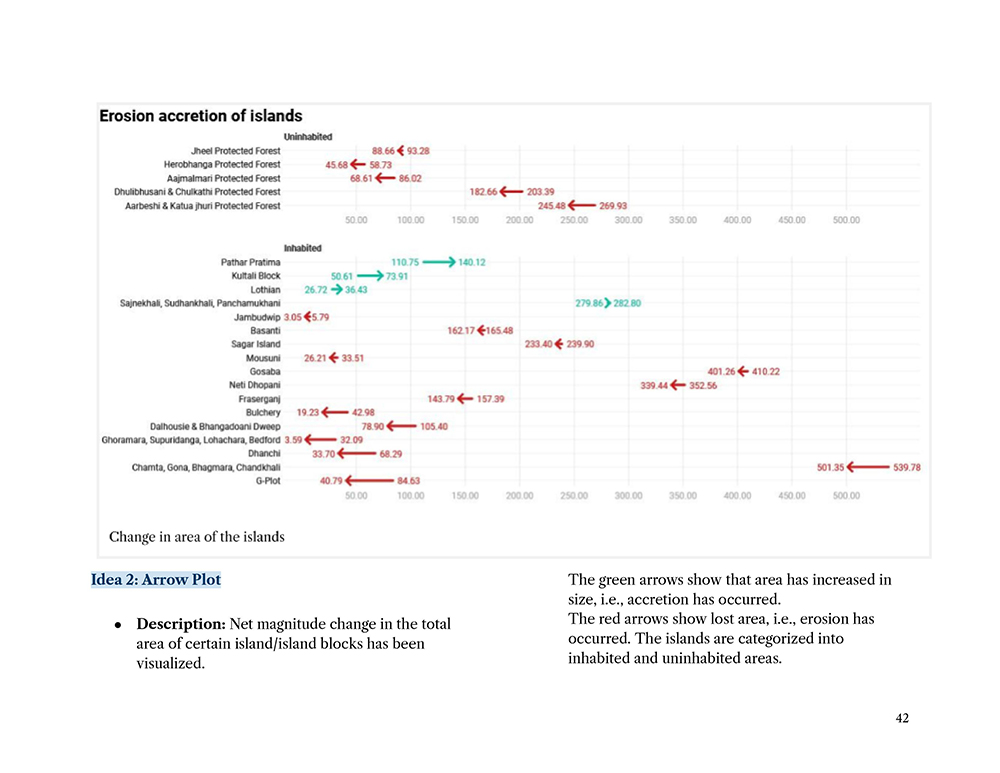
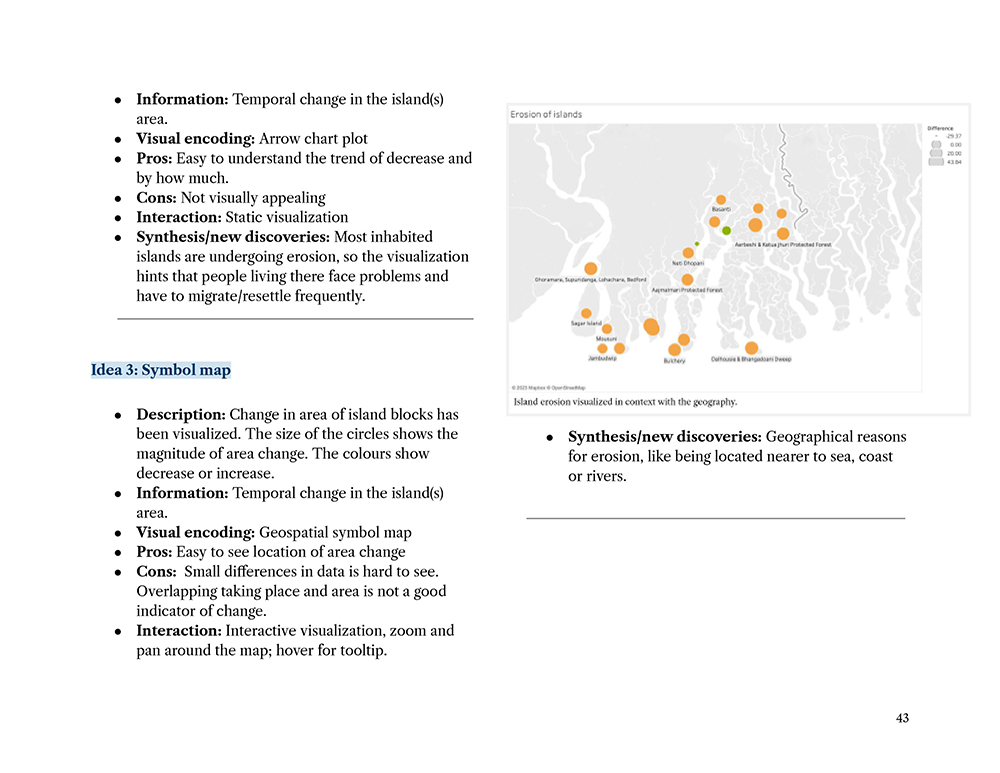
- Terrestrial: Erosion of Islands
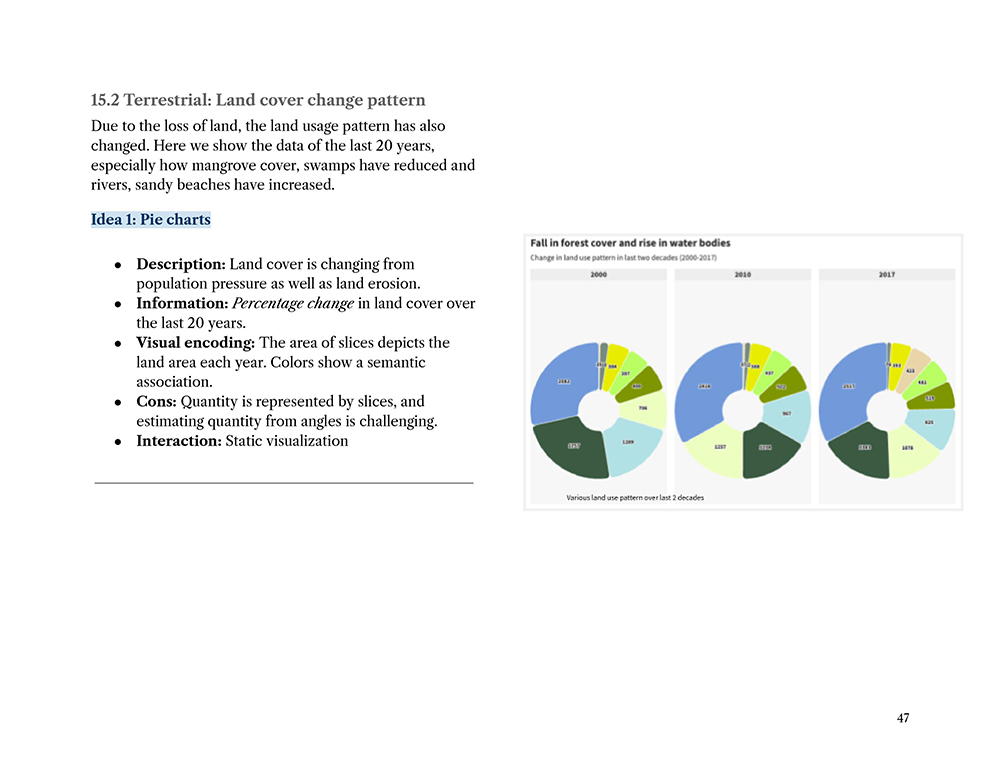
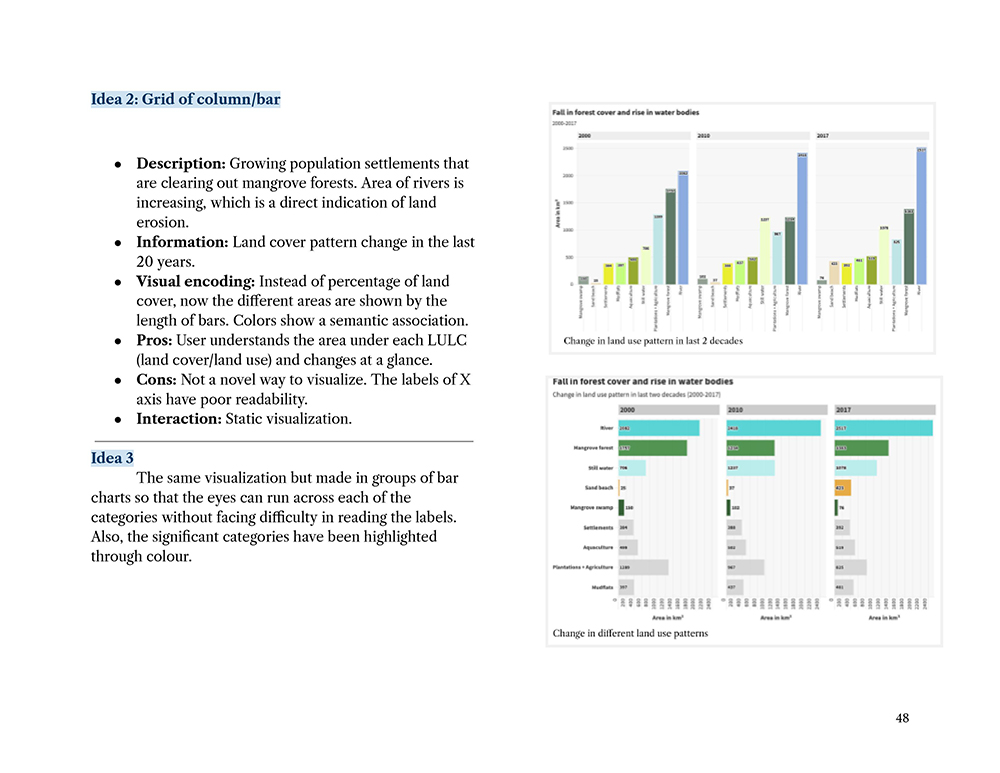
- Terrestrial: Land cover change pattern
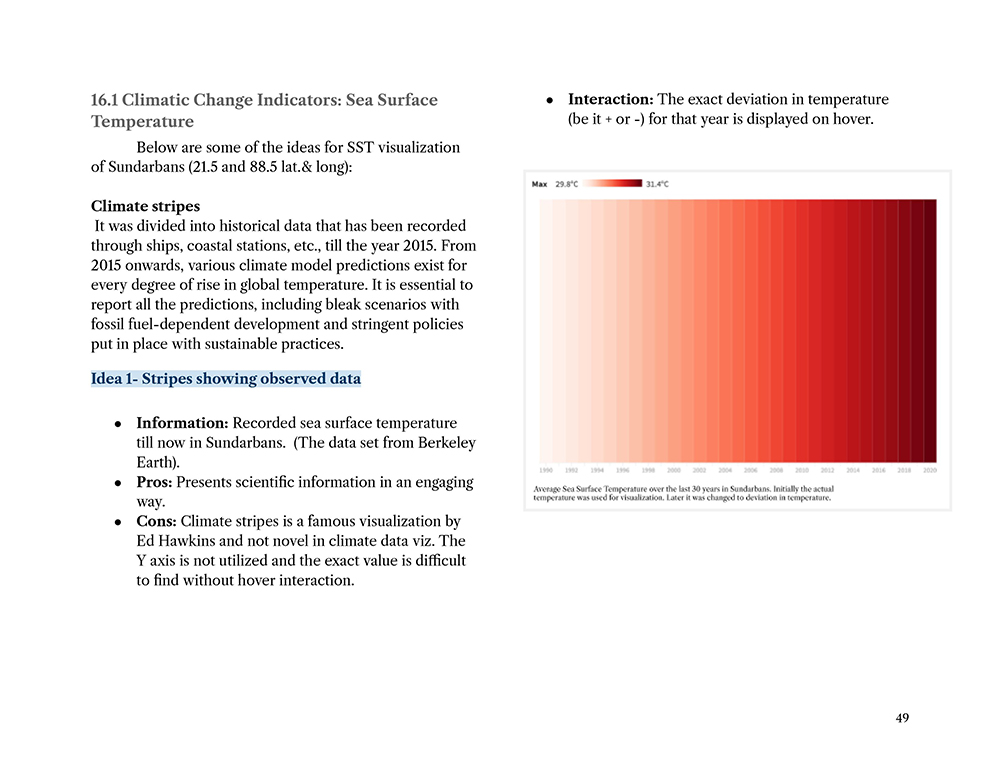
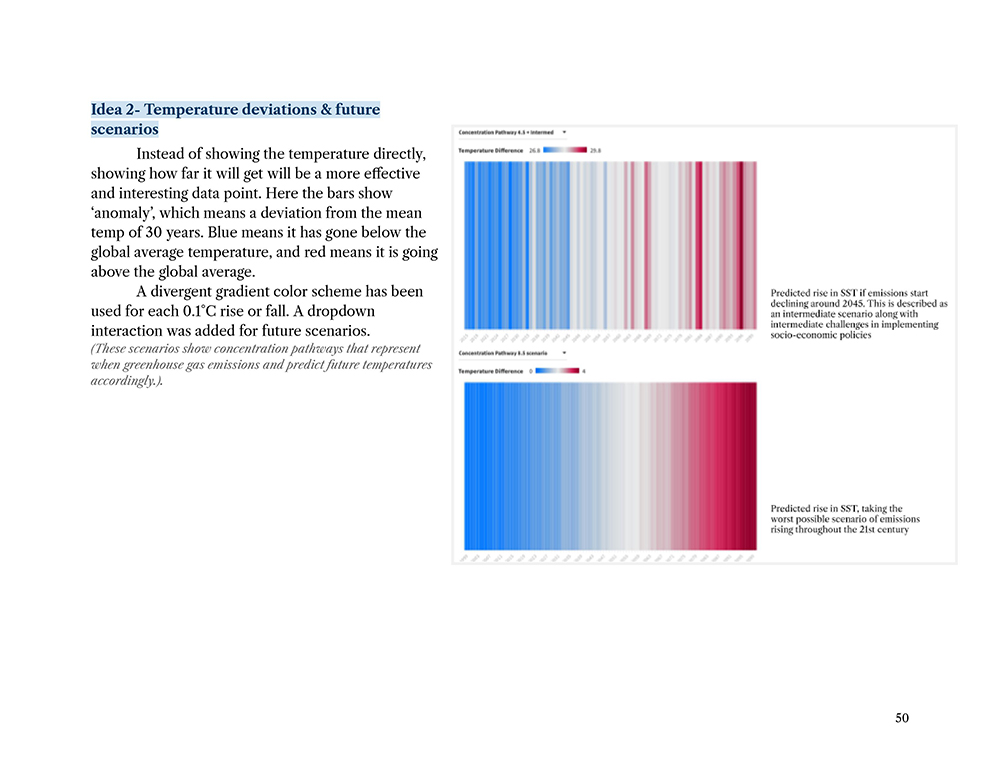
- Sea Surface Temperature
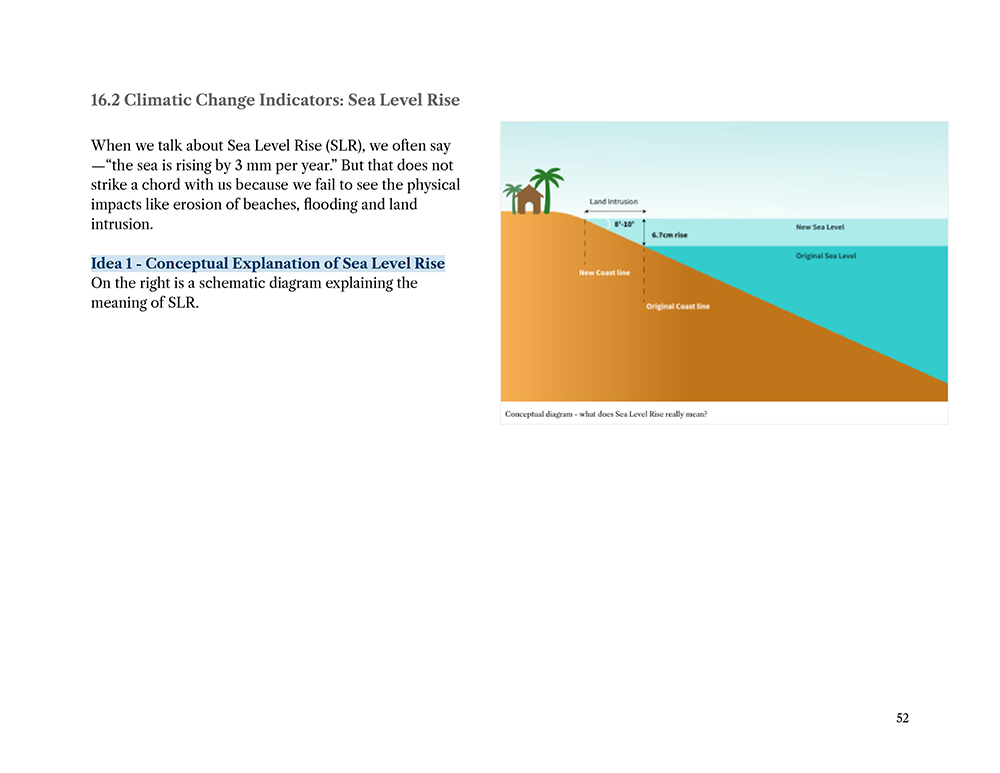
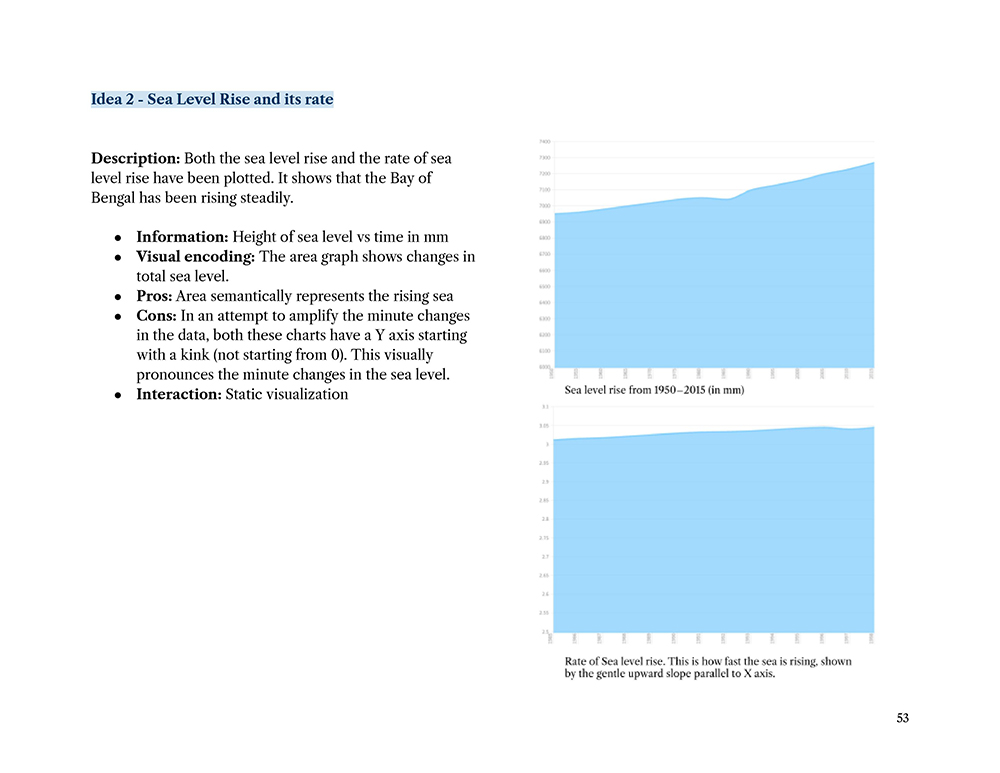
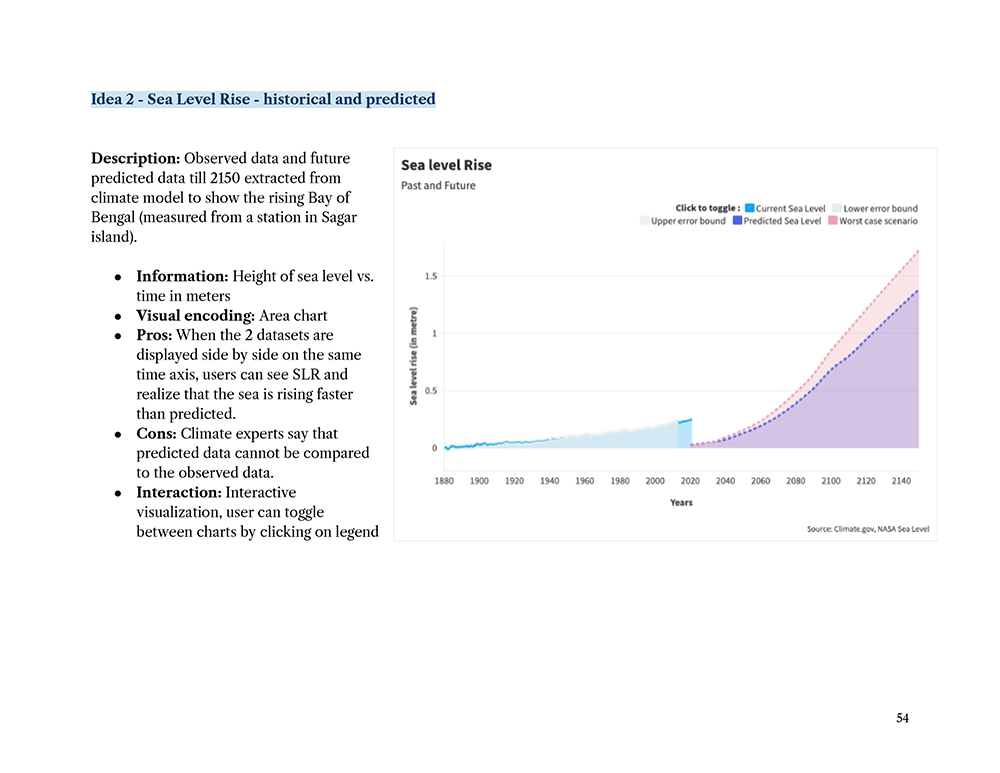
- Sea Level Rise
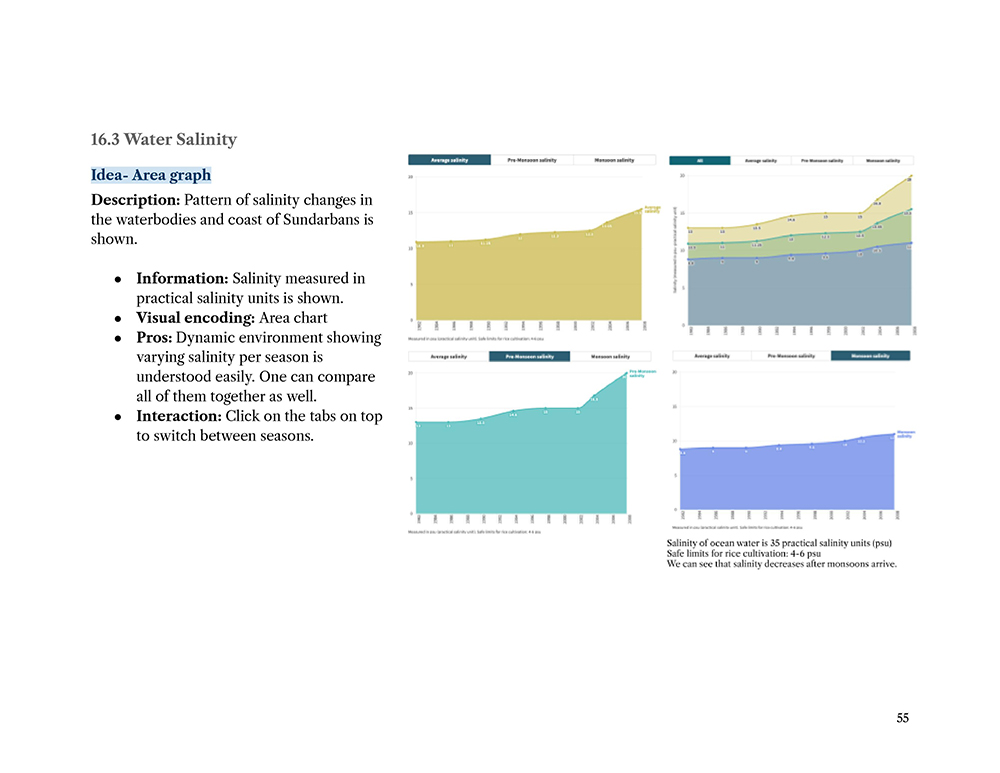
- Water Salinity
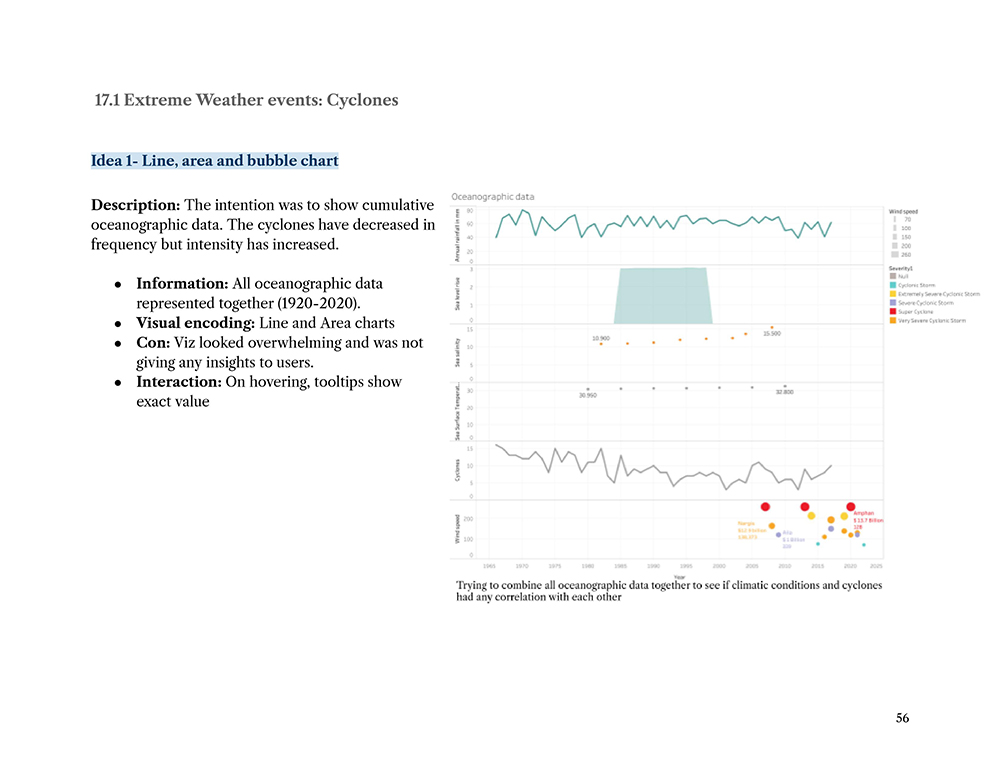
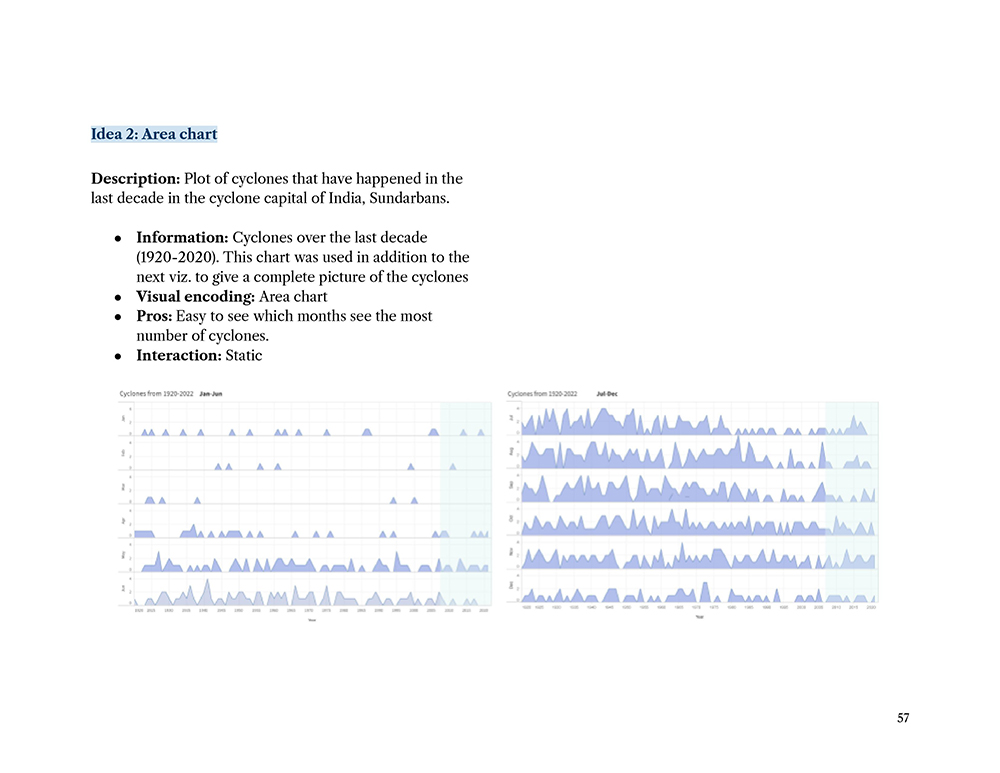
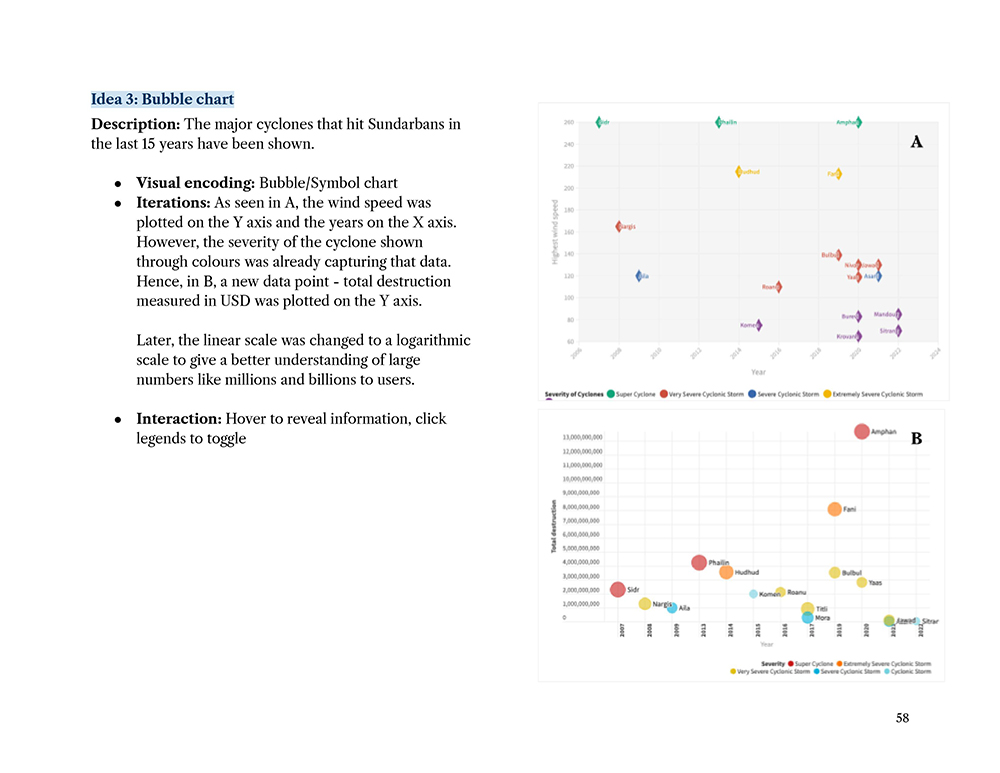
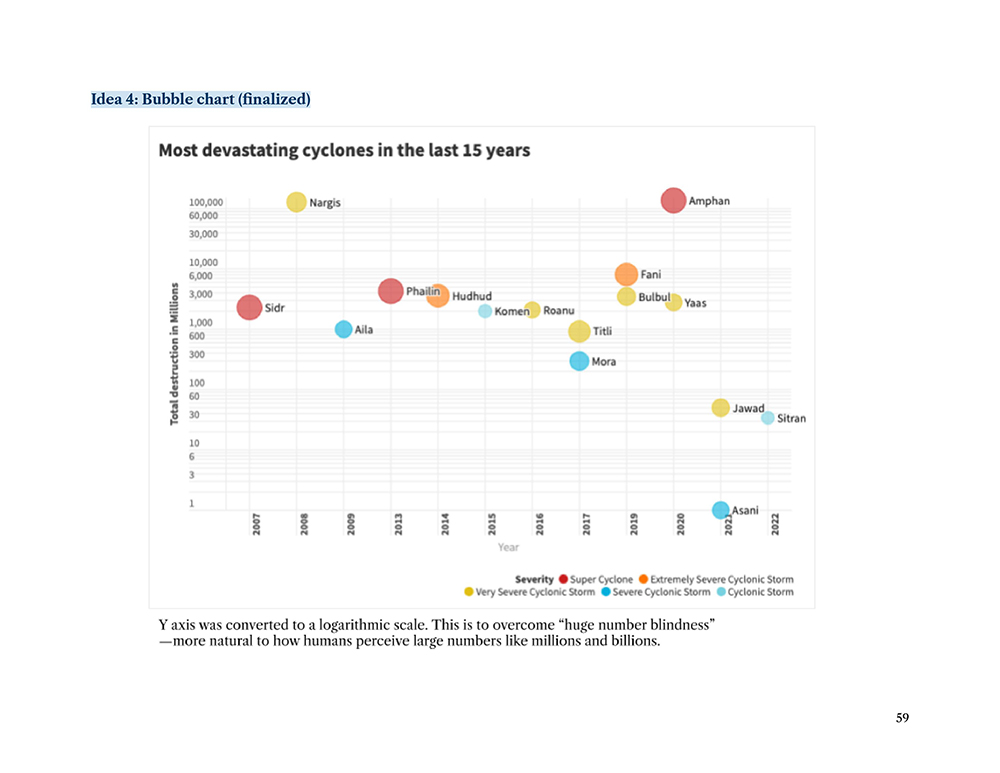
- Extreme Weather events: Cyclones
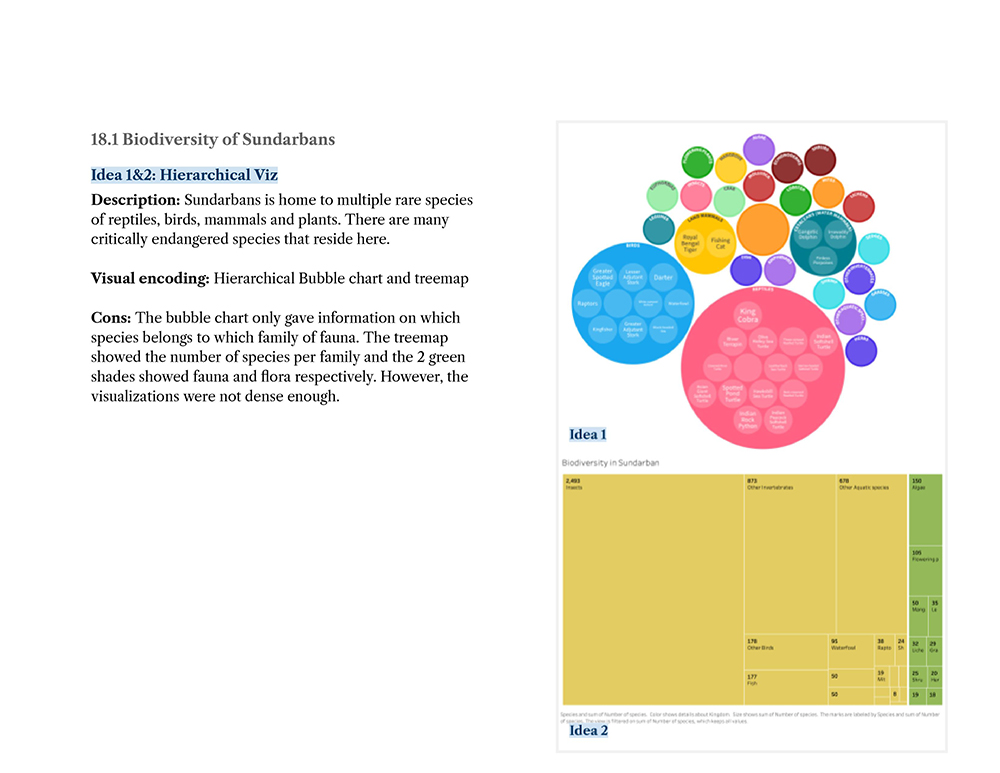
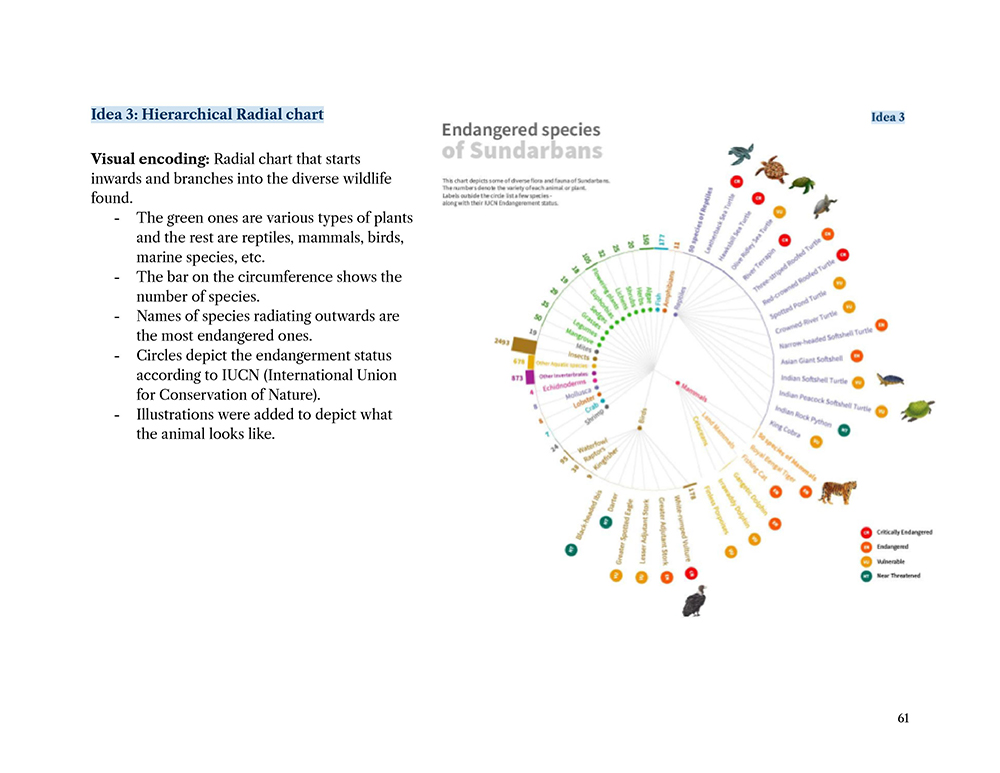
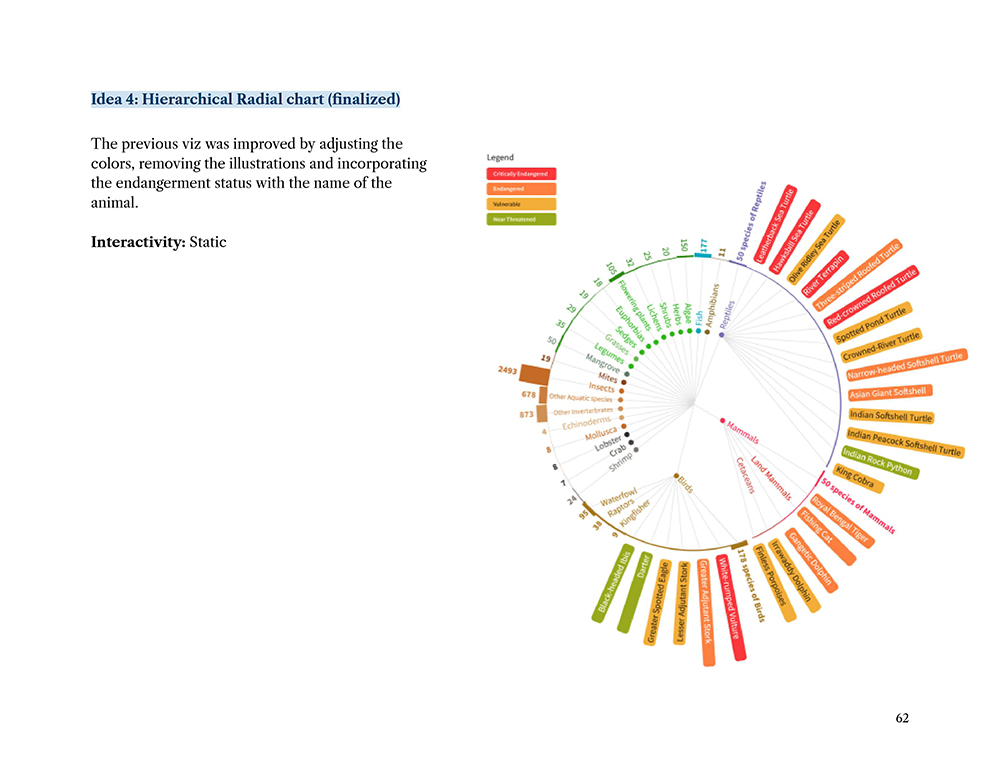
- Biodiversity of Sundarbans
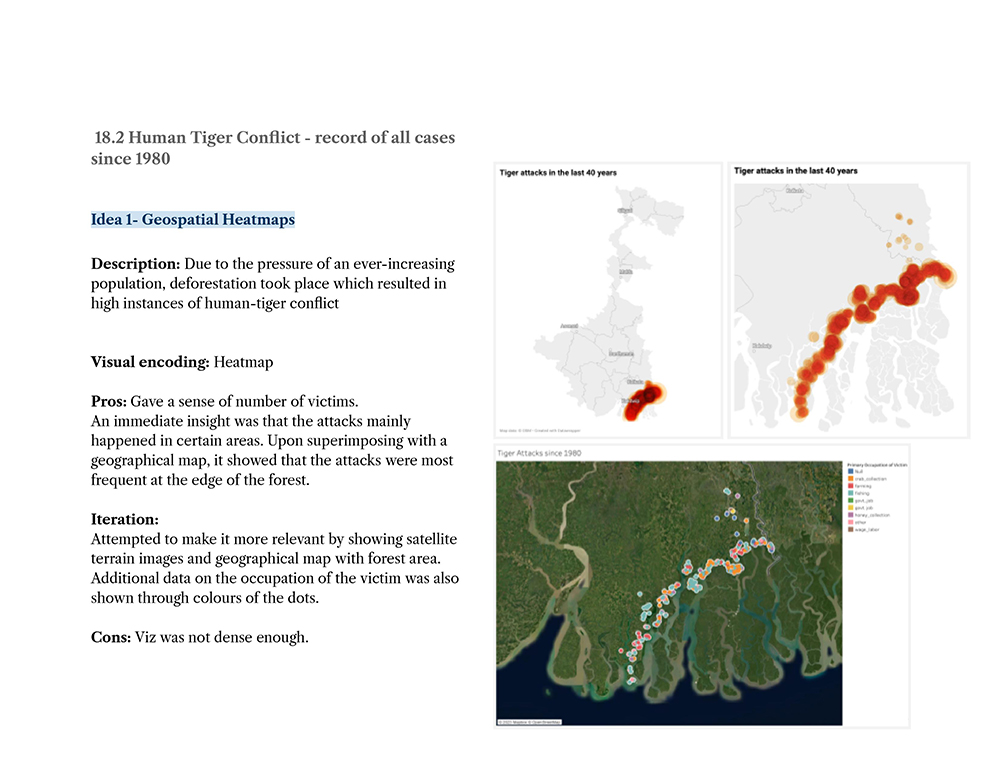
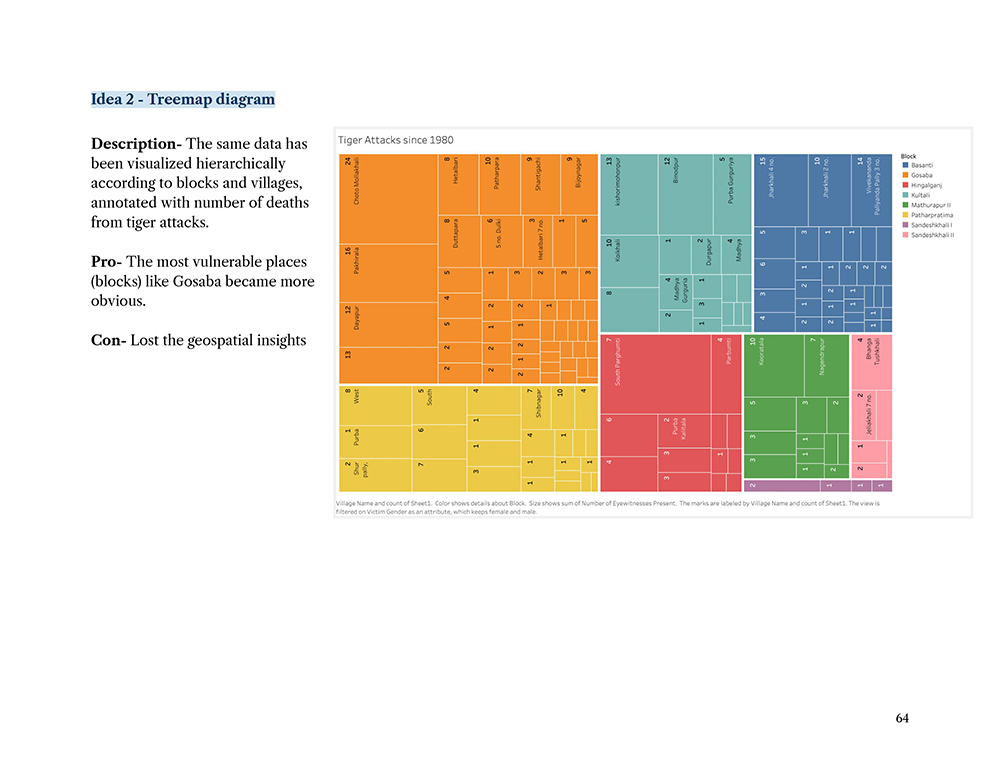
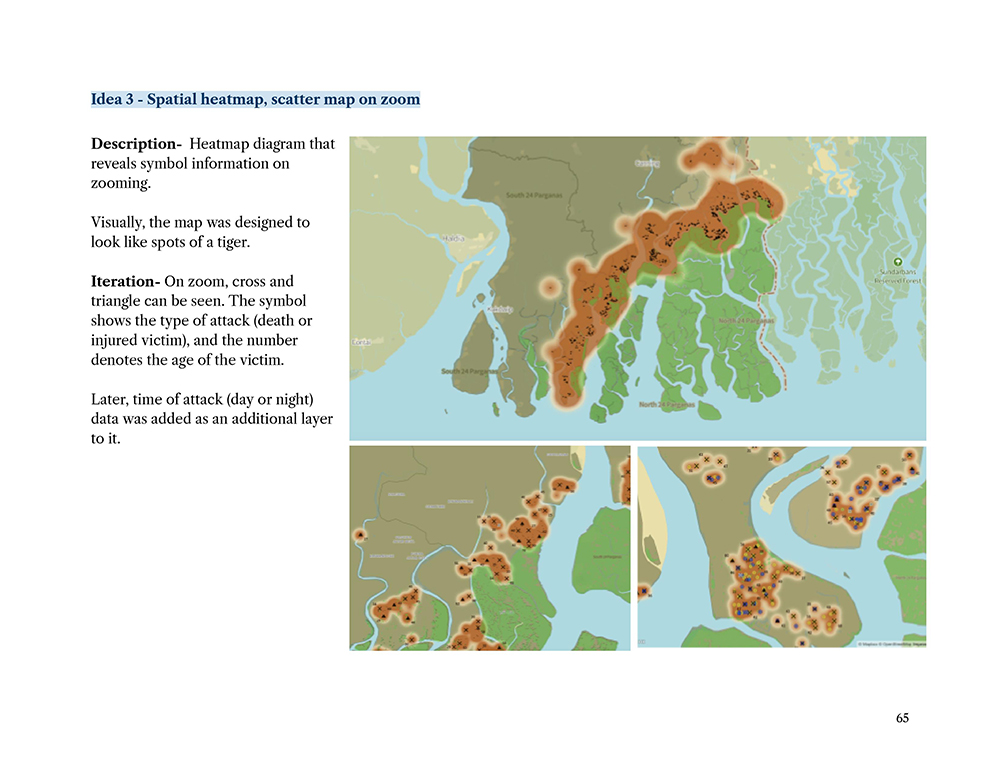
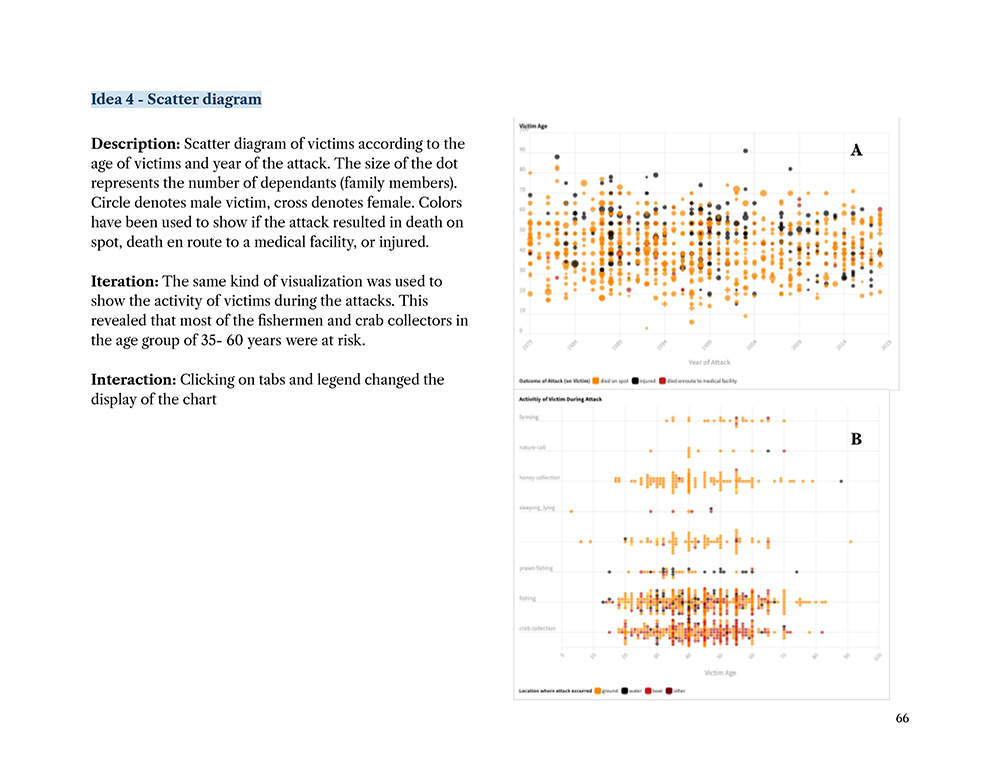
- Human Tiger Conflict
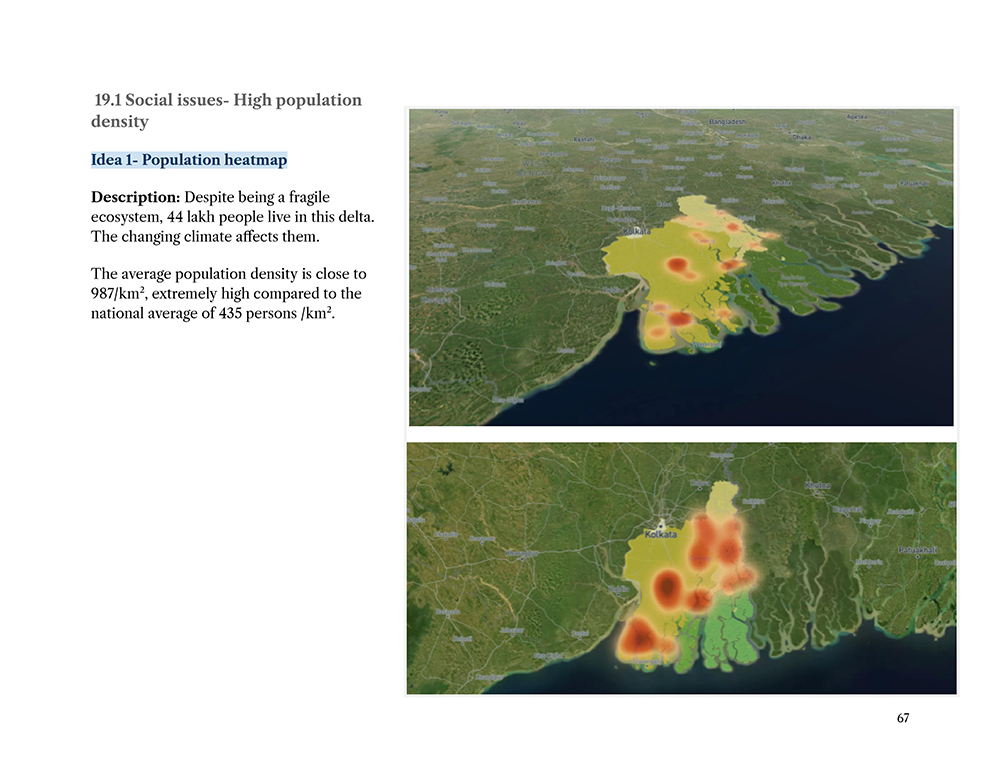
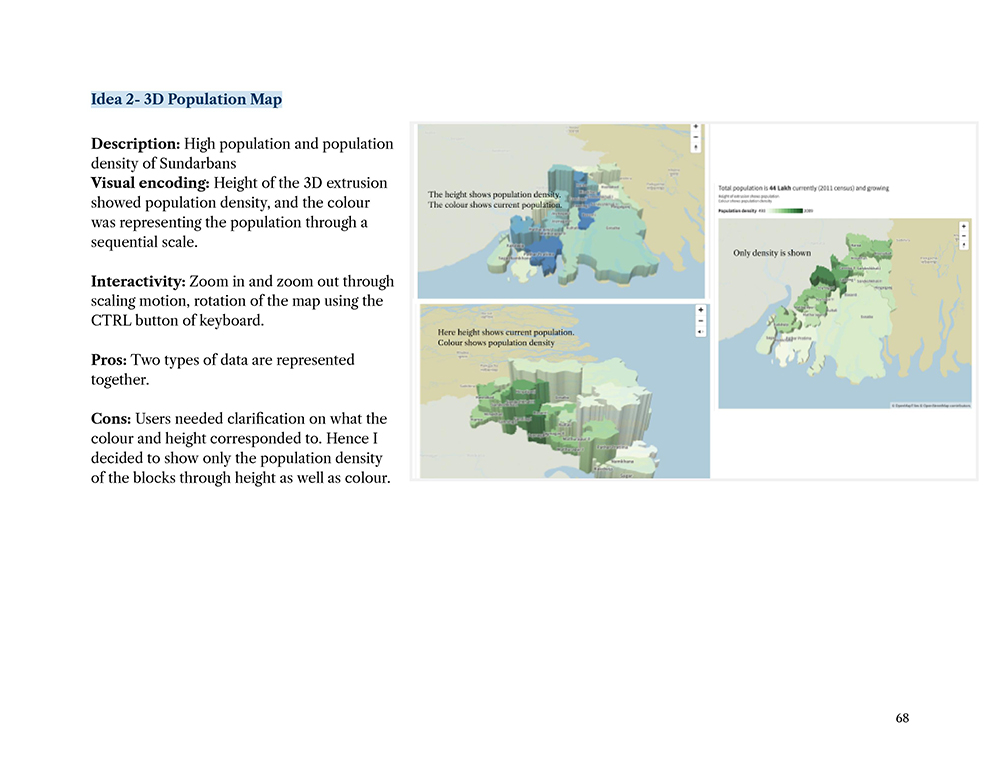
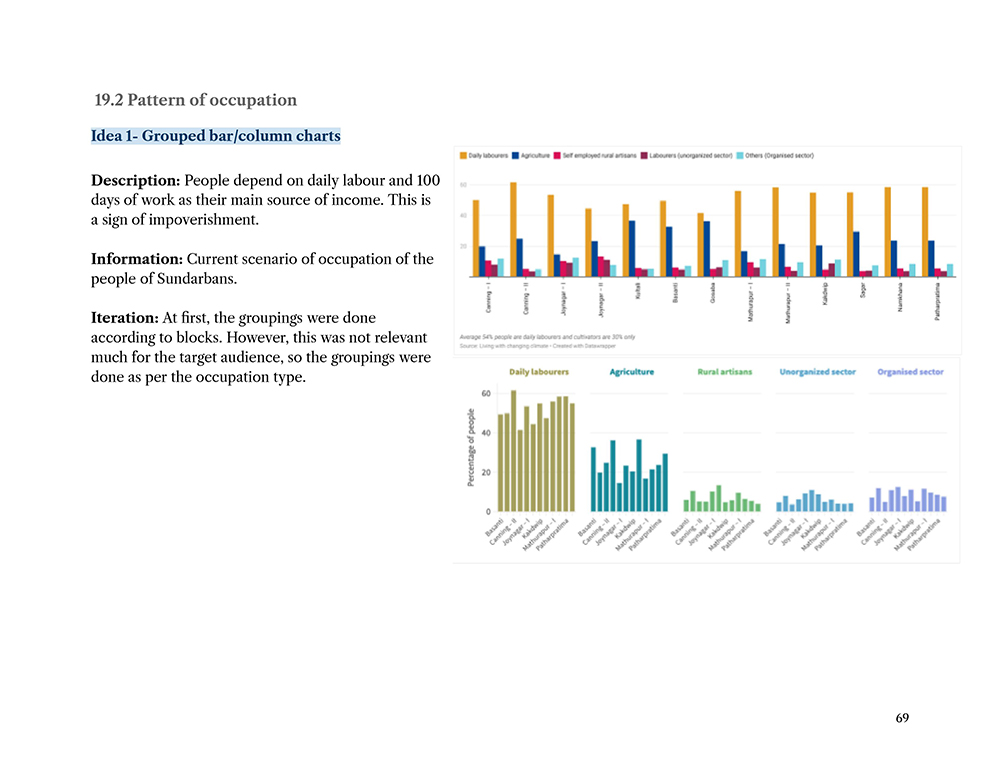
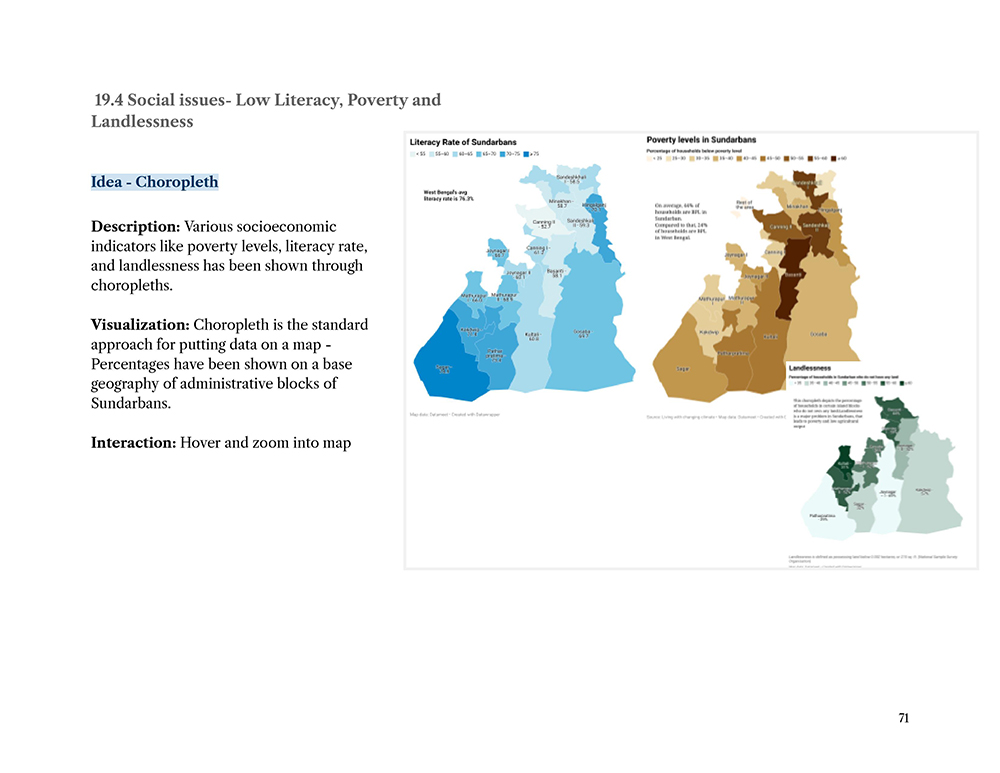
- Social issues- High population density
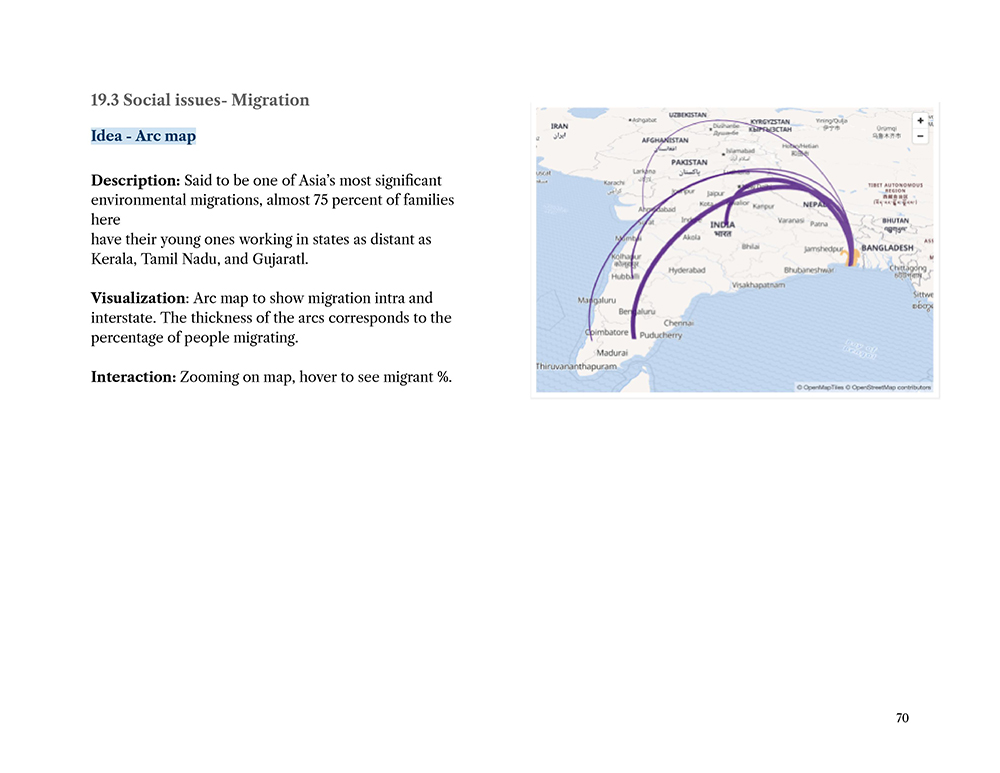
- Social issues- Migration
- Low Literacy, Poverty and Landlessness
• Final Design Output
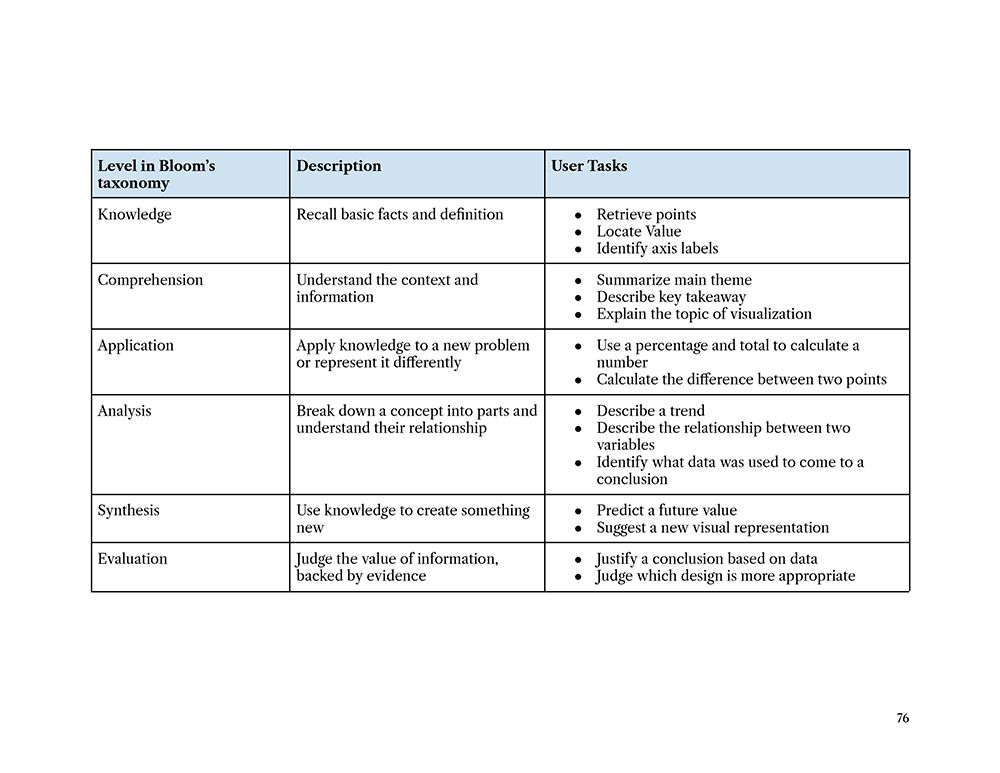
• Evaluation Steps
- Evaluation Plan
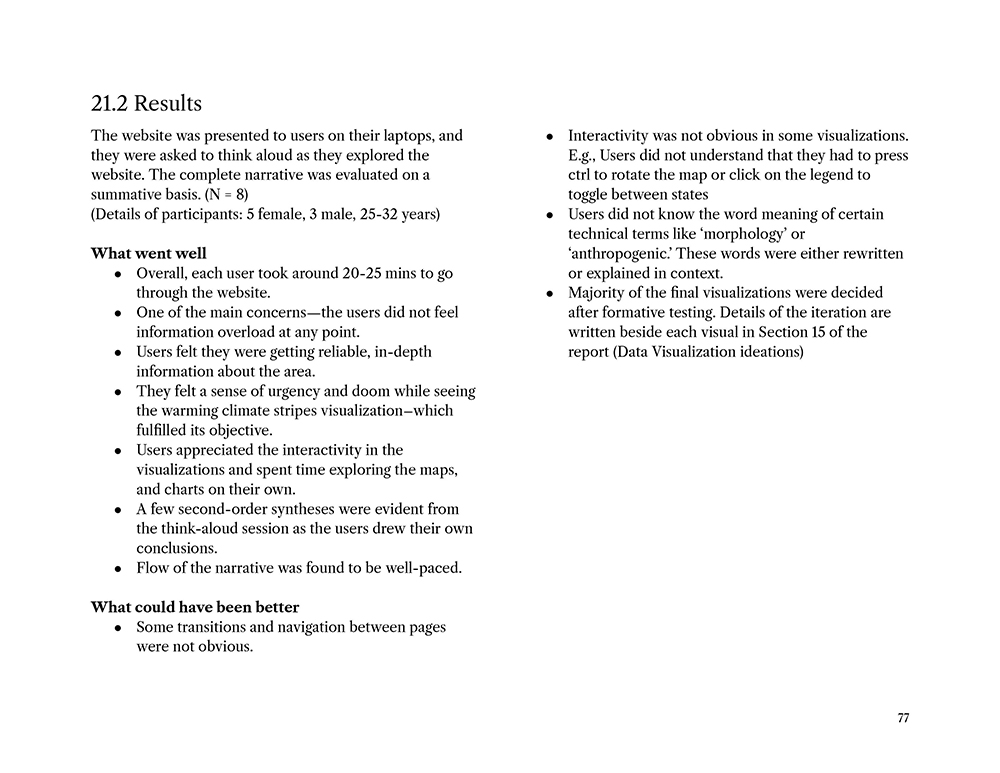
- Results
• Discussion
• Conclusion
• References
• Annexure
Case Study Download:
• Visualizing Ecological Change in the Indian Sundarbans......